Commodities comprise over $6trn of the world’s $33trn pa in global trade, or around 20%, alongside $10trn in services, $2trn of electronic goods, $1trn in cars, $1trn in mechanical capital goods. This data-file breaks down global commodity imports and exports, by country and by region.
Our goal in this database is to disaggregate over $6trn of global commodity trade flows, as global trade is heavily in focus, amidst what seems like an increasingly adversarial world. Hence we have aggregated over 20MB of data from Comtrade. The data are not perfect. Some countries do not report to Comtrade. Where possible, we have manually added these in. We have also tried to clean the data.
Hence this data-file gives a snapshot of global commodity trade, which means the physical movement of a commodity across a national border. For each commodity, we quantify the size of global exports, the size of global imports, commodity exports by region, commodity imports by region, net imports by region, the top ten exporters and the top ten importers. All values are in USD billions.
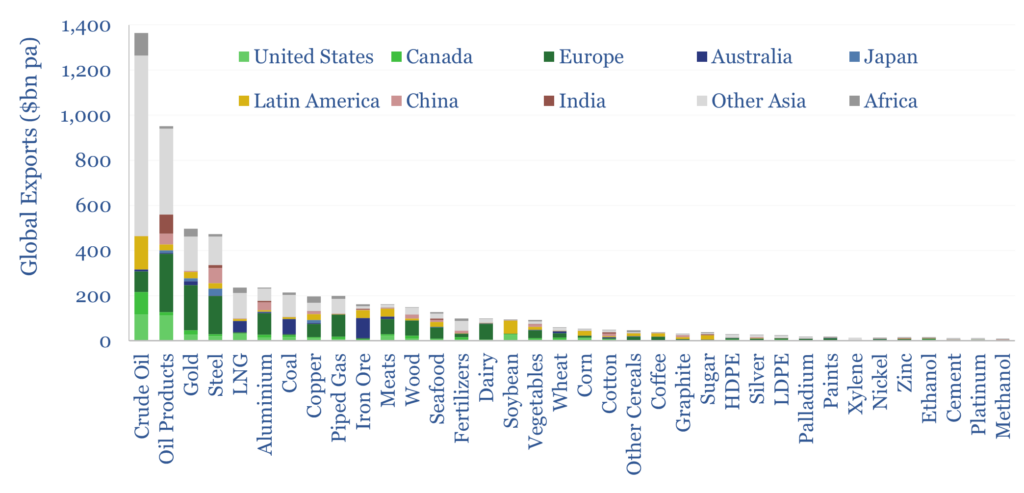
Globally, the top ten commodities traded are crude oil ($1.4trn), oil products ($950bn), gold ($550bn), steel ($470bn), LNG ($260bn), aluminium ($240bn), coal ($210bn), copper ($210bn), piped gas ($210bn) and iron ore ($185bn). This is mostly energy and metals. Global commodity trade, by value, is dominated by energy and metals.
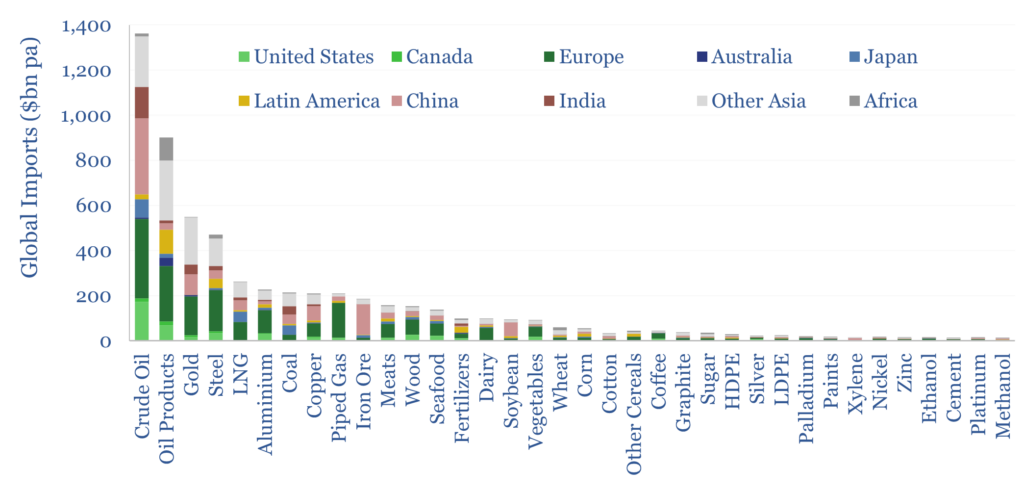
Oil is really huge. Oil and oil products, together, are 40% of global commodity trade. Across every major region in our build-up, its #1 commodity import is either crude oil or oil products. The world’s largest crude exporters are Saudi, UAE, USA, Russia, Iraq, Canada, Nigeria, Norway, Kuwait and Iran. Any of these countries can influence the entire global economy. Historically, some of them have.
Metals such as steel, aluminium and copper are unusual in that most countries are both large importers and exporters simultaneously. China imports $37bn pa of steel and exports $69bn. The US imports $28bn of aluminium and exports $14bn. Canada imports $3bn pa of copper and exports $4bn pa. The reason is that these metals are not entirely commoditized. They are often imported and exported in highly specialized forms – different grades, shapes, structures, components. Hence two countries with an overall balanced net position of trade in metals, can still incur very large tariff costs, if they do levy tariffs on one-another.
Outside of energy and metals, the largest bulk chemicals category is fertilizers at c$100bn pa. The largest crop is soybeans at $90bn pa. All plastic products traded globally are $500bn pa, but we consider different plastics separately, and most cross international borders as plastic products, rather than as raw polymer pellets or feedstocks.
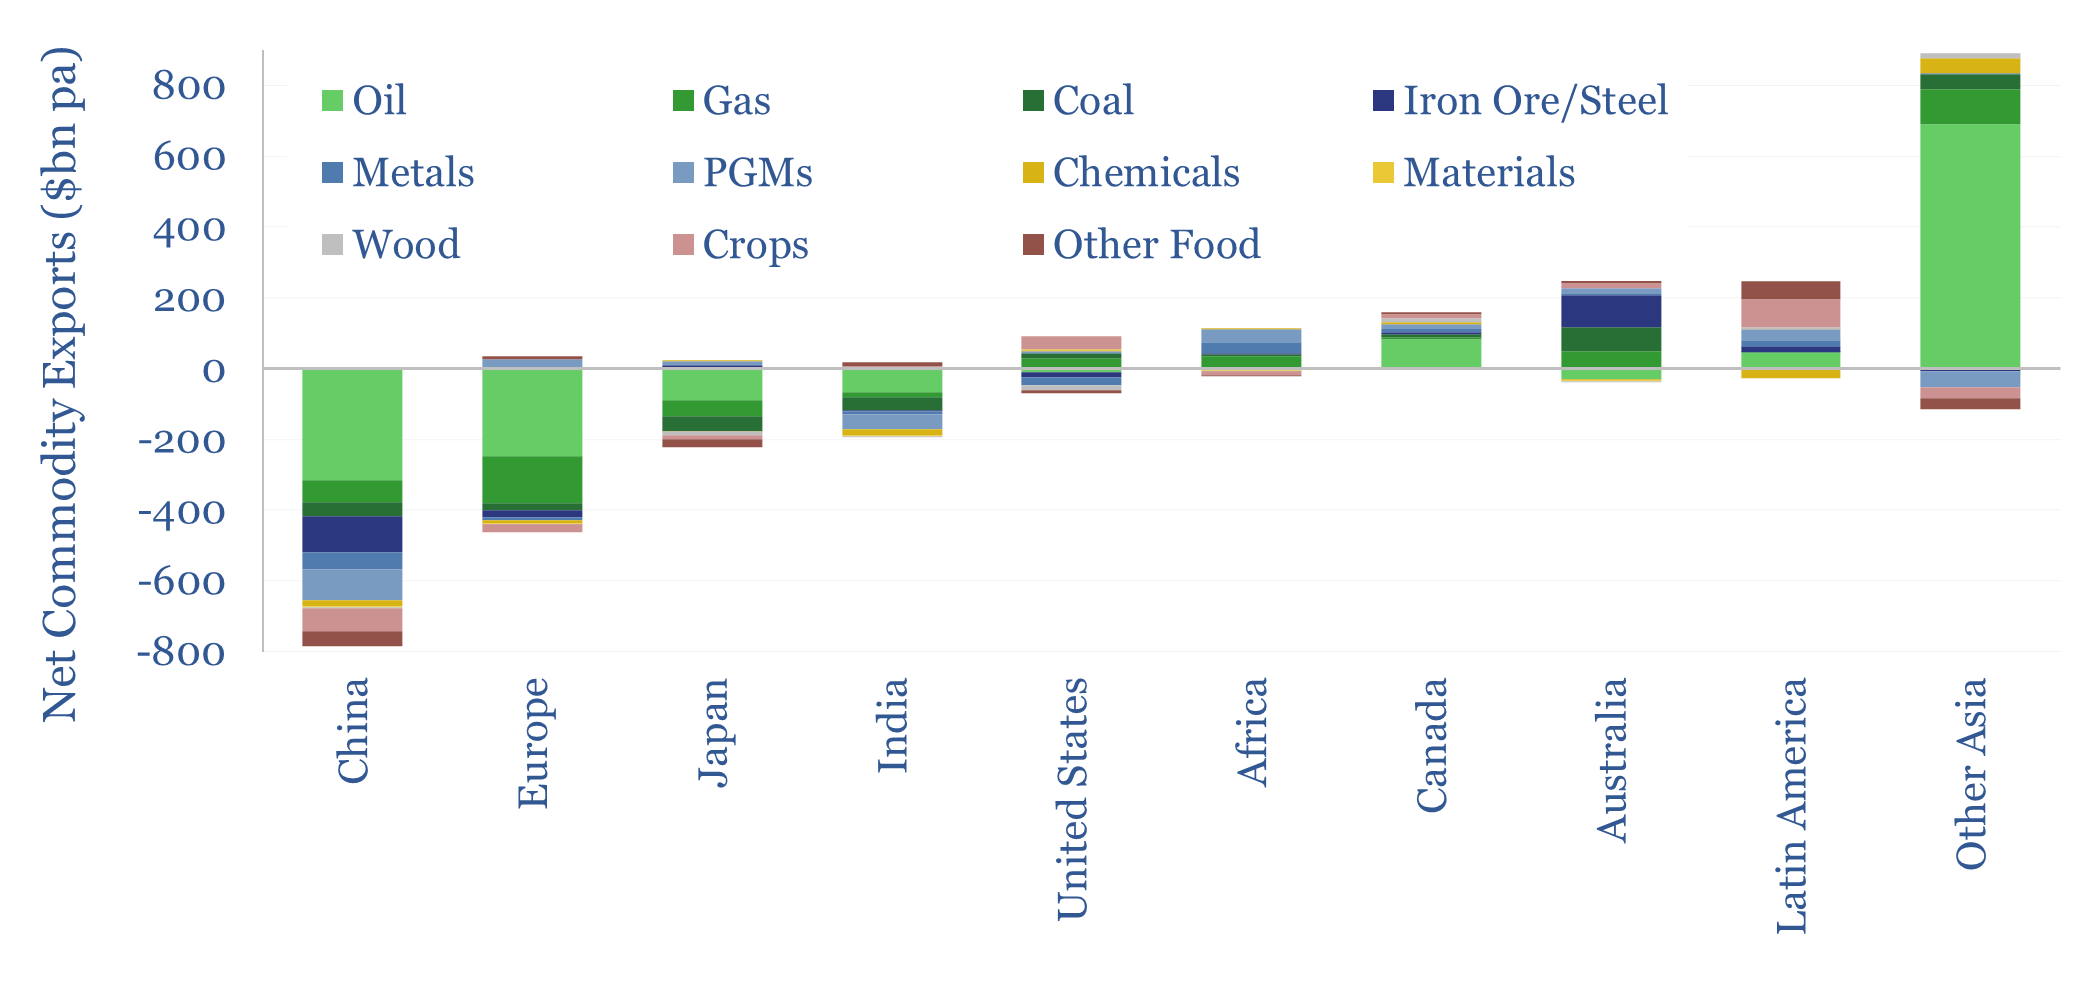
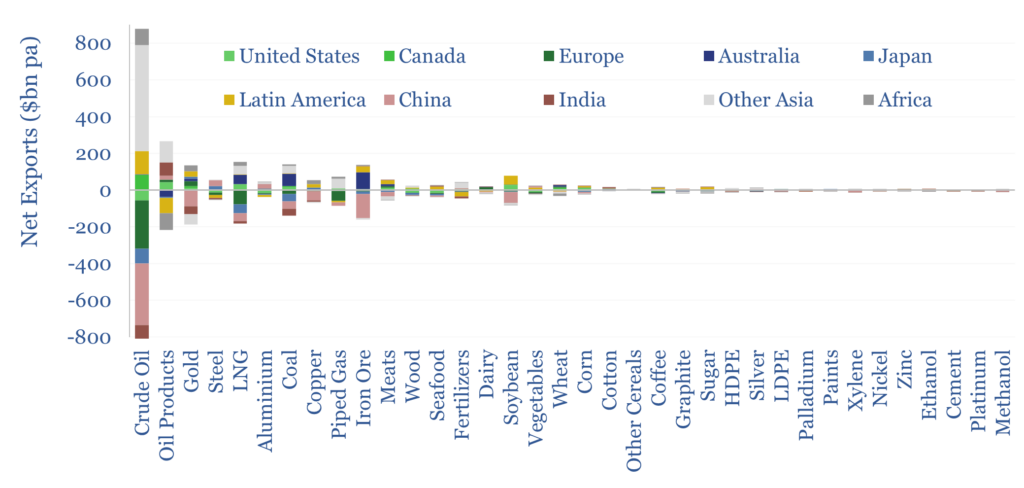
China is the largest net commodity importer in the world, at $800bn pa, of which $340bn is crude oil, $130bn is iron ore, $90bn is gold, $60bn is gas, $50bn is copper and $40bn is coal. China uses these to make over $3trn pa in exports. So overall, it is the largest net exporter in the world at $580bn pa. Thus China is a remarkable economy in turning commodity inputs into manufactured outputs.
Europe is the second-largest net commodity importer, at $425bn pa, of which $260bn pa is crude oil and $130bn pa is gas. Its largest net commodity export positions are now gold ($27bn) and dairy ($15bn). It is not a major bulk commodity power. Do not overlook that it is nevertheless a precision manufacturing power. We do think Europe is turning a corner, re-considering its industrial competitiveness, and helped by increasingly cost-effective solar and batteries.
The US is the world’s largest goods importer at $1.2trn pa, but its commodity imports-exports are balanced. It net imports $55bn of crude, but net exports $44bn of oil products. These are the two biggest positions. Elsewhere, the US net-imports $16bn pa of seafood, $15bn pa of wood, $14bn pa of aluminium, $13bn pa of steel, $7bn pa of coffee and $4bn pa of copper; but it net-exports $33bn pa of LNG, $27bn pa of soybean, $15bn pa of coal, $13bn pa of corn, $11bn pa of gold, $9bn pa of meat, $6bn pa of cotton, $5bn pa of wheat, $4bn pa of ethanol, $3bn pa of polyethylene. The large number of positions – both imports and exports – might suggest that free-flowing commodity trade is beneficial to the US.
Australia, Canada and Brazil are the commodity powerhouses. Especially Australia. Compared to its $1.7trn in GDP, our data-file captures $220bn of Australian commodity exports, mainly iron ore ($90bn pa), coal ($70bn) and LNG ($50bn).
Brazil is also an agricultural commodity powerhouse. It is the world’s #1 exporter of soybeans ($53bn pa), meat ($22bn), sugar ($16bn), corn ($14bn pa) and coffee ($7bn). We also have more granular data on global food production.
Disruptions to commodity trade flows cause prices to rise sharply. We see this in the lognormal distribution of commodity prices. We see it in commodity pricing during war-times. It remains to be seen whether a trade war has the same impact on commodity flows, and thus on aggregate prices, as a traditional war, but if trade flows are disrupted, we suspect they are similar.