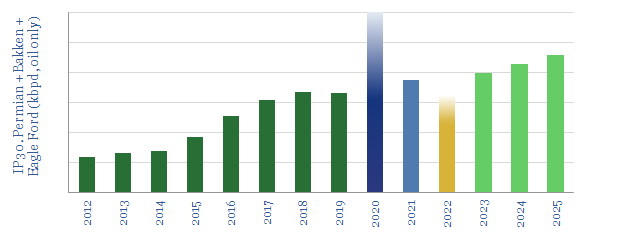
Unprecedented high-grading is now occurring in the US shale industry, amidst challenging industry conditions. This means 2020-21 production surprising to the upside, and we raise our forecasts +0.7 and +0.9Mbpd respectively. Conversely, when shale activity recovers, productivity could disappoint, and we lower our 2022+ forecasts by 0.2-0.9 Mbpd. This 7-page note explores the causes and consequences of this whipsaw effect.
Smart energy systemsare capable of transmitting and receiving real-time data and instructions. They open up new ways of optimizing energy efficiency, peak demand, appliances and costs. Over 100M smart meters and thermostats had been installed in the United States (including at c90M residences) and 250M have been installed in Europe by 2020.
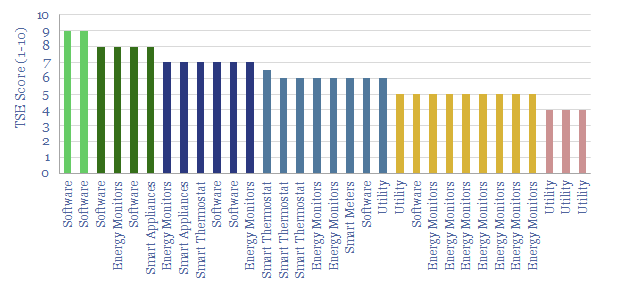
The purpose of this data-fileis to profile c40 companies commercializing opportunities in smart energy monitoring, smart metering and smart thermostats. The majority are privately owned, at the venture or growth stage. We also tabulate their patent filings.
We find most of the offeringswill lower end energy demand (by an average of 7%), assist with smoothing grid-volatility, provide appliance-by-appliance demand disaggregations and encourage consumers to upgrade inefficient or potentially even defective appliances. Numbers are tabulated in the data-file to quantify each of these effects.
Further research. Our recent commentary that summarises the key points on Smart energy systems is linked here. Our outlook on the most conductive metals used in the energy transition is linked here.
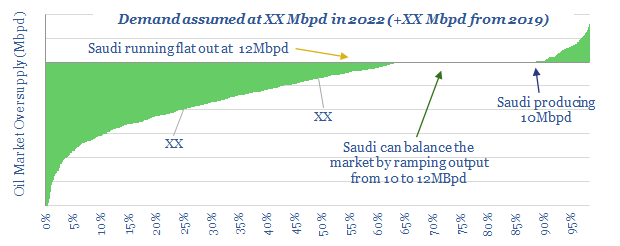
Oil prices must entrench well above $50/bbl for 2023-25 oil markets to balance. But prices could materially overshoot. This short 4-page note presents our latest conclusions, and top charts on oil supply-demand, including our outlook to 2025.
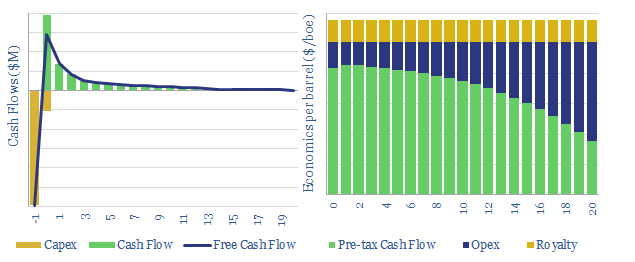
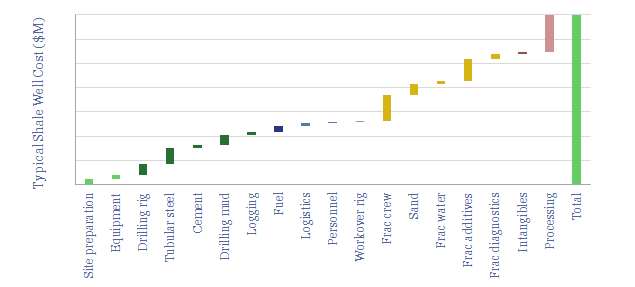
This data-model breaks down the economics of US shale, in order to calculate NPVs, IRRs and oil price break-evens of future drilling in major US basins (predominantly the Permian, but also Bakken and Eagle Ford).
Our base case conclusionis that a $40/bbl oil price is required for a 10% IRR on a $7.0M shale well with 1.0 kboed of IP30 production. Break-evens mostly vary within a range of $35-50/bbl. They are most sensitive to productivity, which can genuinely unlock triple-digit IRRs, even at $40/bbl.
Underlying the analysisis a granular model of capex costs, broken down across 18 components (chart below). Shale economics are calculated off of input variables such as rig rates, frac crew costs, diesel prices, sand prices, tubular steel prices, cement prices and other more niche services.
Stress-testing the model. You can flex input assumptions in the ‘NPV’ and ‘CostBuildUp’ tabs of the model, in order to assess economic consequences. For a similar model of shale gas, please see our model here.
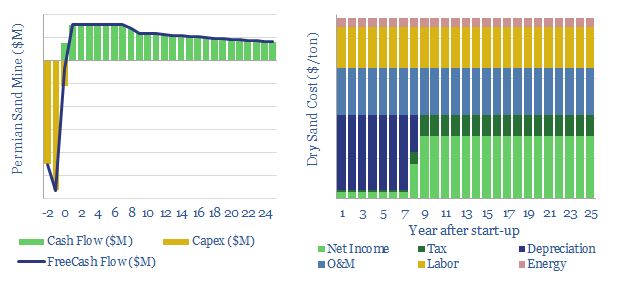
This model is a very simple breakdown of economics for in-basin sand production, around the US shale industry. We estimate the price that must be charged at the mine gate for a typical facility to make a 10% return.
The model can also be used to quantify the potential savings from shifting from dry sand to wet sand, estimated at c25% of total costs.
20% of Europe’s renewable electricity currently comes from biomass, mainly wood pellets, burned in facilities such as Drax’s 2.6GW Yorkshire plant. But what are the economics and prospects for biomass power as the energy transition evolves? This 18-page analysis leaves us cautious.
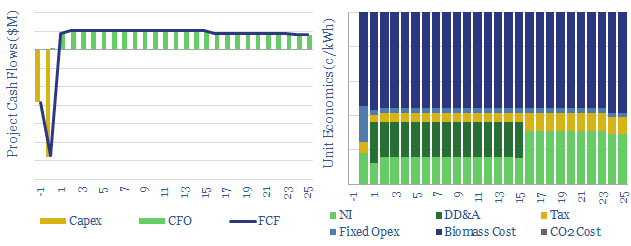
This model captures the costs of biomass power, from wood pellets to BECCS. A levelized cost of 13c/kWh is necessary for a new 100MW plant, with capex costs of $1,700/kW and burning $150/ton wood pellets to earn a 10% IRR while generating electricity. Please download the data-file to stress test biomass power costs.
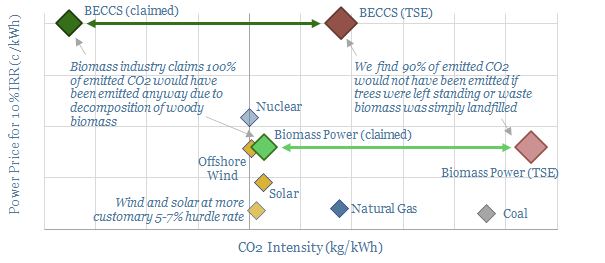
A greenfield biomass plant needs a 13c/kWh power price for a 10% IRR. This is pricey, equivalent to a CO2 cost above c$200/ton. Cash operating costs for biomass power are likely around 8c/kWh, in our build up.
Our base case assumptions reflect a 100MW facility, with 40% efficiency, burning pellets costing $120/ton. Although we would note that some past projects have been smaller, less efficient and paid $140-210/ton for pellets. These numbers can be stress-tested in the data-file.
CO2 credentials are debatable. Burning wood emits 1.2 tons of CO2 per MWH. This is 3x more than a MWH of gas-power. 90% of biomass CO2 emissions could have been avoided if trees were left standing or waste wood was landfilled. Our merit order for wood uses is discussed here.
What are the costs of biomass pellets? One of the tabs of the model builds up the economics and derives a cost of $120/ton, to earn a 10% IRR on a pellet mill with a capex of $80/Tpa. Economics are also sensitive to energy prices due to the energy consumption of dry wet biomass in the pelletization process.
What are the costs of BECCS? BECCS adds CCS onto a wood-burning power plant. We can get to power costs in the range of 20-30c/kWh, however this is after unavoidably heavy energy penalties and requires extensive gas clean-up to avoid combustion contaminants from degrading amines.
Data are also aggregated on the generation and efficiency of c340 woody-biomass power plants constructed to-date in the United States; and on the energy contents of different biomass fuels, from straw, to wet wood, to dry wood to pellets.
Please download the data-file to stress test biomass power costs and run your own input-output analysis.
Solar panel costshave been deflating at a rate of c20% per annum as the industry scales up into manufacturing mode. The IEA recently stated solar could thus provide the “cheapest electricity in history”.
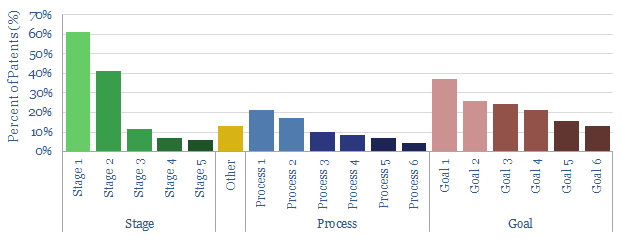
What next? To answer this question, we reviewed 70 patents filed by leading solar manufacturers in 2020, in order to see what challenges they are aiming to resolve. We expect deflation to continue apace, while panels will also gain greater efficiency and longevity.
This data-fileexplains the conclusions, summarizing the findings from the patents and giving specific examples of gains in the offing.
Specific companies’ focusescan also be seen from the patents. Covered companies include Canadian Solar, Hanergy, Jinko, LG, Miasole, Panasonic, SunPower et al.
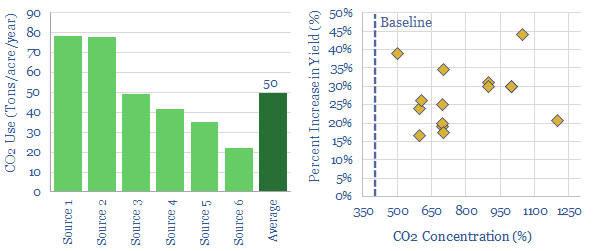
Enhancing the concentration of CO2 in greenhouses can improve agricultural yields by c30%. It costs $4-60/ton to supply this CO2, while $100-500/ton of value is unlocked. Shell and ABF have already under-taken projects, while industrial gas and monitoring companies can also benefit. But the challenge is scale. Around 50Tpa of CO2 is supplied to each acre of greenhouses. Only c10% is sequestered. So the total CO2 sequestration opportunity may be limited to around 50MTpa globally.
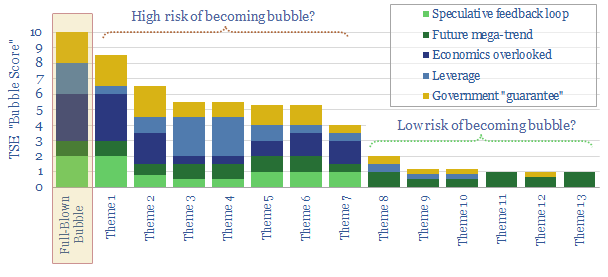
Investment bubblesin history typically take 4-years to build and 2-years to burst, as asset prices rise c815% then collapse by 75%. In the aftermath, finances and reputations are both destroyed. There is now a frightening resemblance between energy transition technologies and prior investment bubbles. This 19-page note aims to pinpoint the risks and help you defray them.
Cookies?
This website uses necessary cookies. Our cookies are simply to improve your experience. We do not undertake any advertising or targeting via our cookies. By clicking 'accept' or continuing to use the website, you consent to our use of cookies.AcceptRead More
Privacy & Cookies Policy
Privacy Overview
This website uses cookies to improve your experience while you navigate through the website. Out of these, the cookies that are categorized as necessary are stored on your browser as they are essential for the working of basic functionalities of the website. We also use third-party cookies that help us analyze and understand how you use this website. These cookies will be stored in your browser only with your consent. You also have the option to opt-out of these cookies. But opting out of some of these cookies may affect your browsing experience.
Necessary cookies are absolutely essential for the website to function properly. This category only includes cookies that ensures basic functionalities and security features of the website. These cookies do not store any personal information.
Any cookies that may not be particularly necessary for the website to function and is used specifically to collect user personal data via analytics, ads, other embedded contents are termed as non-necessary cookies. It is mandatory to procure user consent prior to running these cookies on your website.