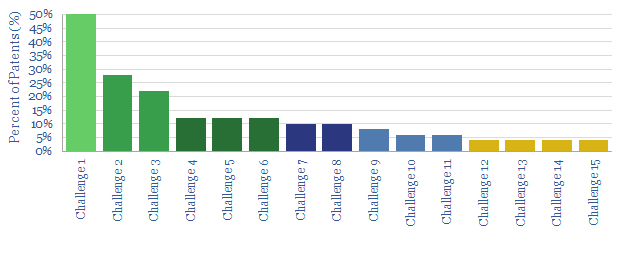
This data-file tabulates the greatest challenges for charging electric vehicles, based on the recent patent literature, looking across fifty patents filed by leading companies.
Our top three conclusionsare that EV charging will require complex algorithms to ensure grid stability, creating an opportunity for big data companies; vehicle-manufacturers are concerned about balancing the convenience of EV charging with the investment costs of charging networks; while interestingly, increasing speed of charging is not a primary focus.
Our conclusionsare typed up in the data-file, plus the full back-up of patents from large OEMs, EV-charging specialists, capital goods companies that make components and tech giants, working on optimization algorithms.
Drilling wells and lifting fluids to the surface are core skills in the oil and gas industry. Hence could geothermal be a natural fit in the energy transition? This 17-page note finds next-generation geothermal economics can be very competitive, both for power and heat. Pilot projects are accelerating and new companies are forming. But the greatest challenge is execution, which may give a natural advantage to incumbent oil and gas companies.
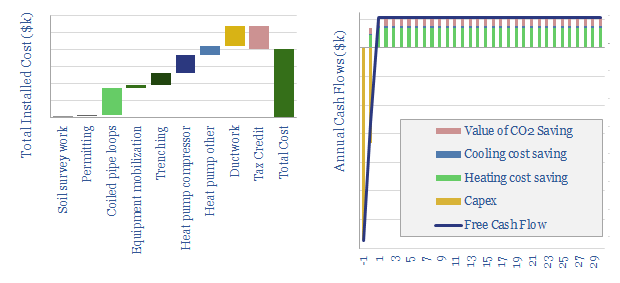
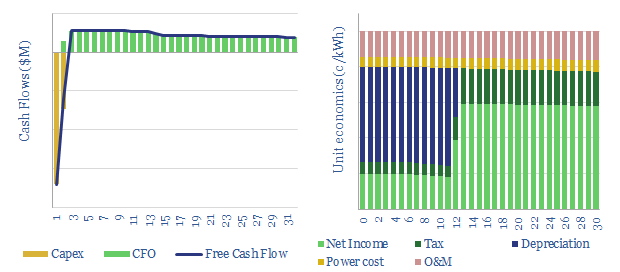
This data-file models heat pump economics, costs, energy savings and potential CO2 savings of a ground source heat pump (GHP), compared to traditional home heating and cooling options.
A GHP approximately doubles the efficiency of conventional heating and cooling, through heat-exchange with the shallow earth, 30ft below the surface, which tends to remain at 10-15°C temperatures year-round.
The model can be stress-tested, flexing annual heating/cooling demands, coefficients of performance, as well as oil, gas, power and CO2 prices, to see how heat pump economics vary. Also included are a granular cost build-up for CHPs and our notes.
The capex costs of electric pumps in general, pump opex, pump energy consumption and the efficiency of pumps are reviewed from first principles in this data-file. Total pump costs can be ballparked at $600/kW/year of power, of which 70% is electricity, 20% operations and maintenance, 10% capex/capital costs. But the numbers vary.
Enhanced geothermal has accelerated by 3x in the past half-decade and this research note evaluates the energy economics of enhanced geothermal from first principles. Geothermal power is produced from 200 geothermal fields globally, feeding 16GW of power capacity, generating around 110 TWH of useful electricity, which equates to 0.4% of the world’s electricity and 0.15% of its total useful energy.
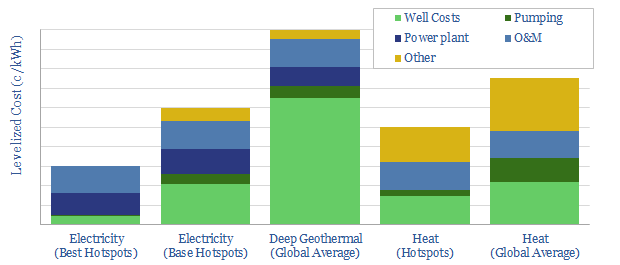
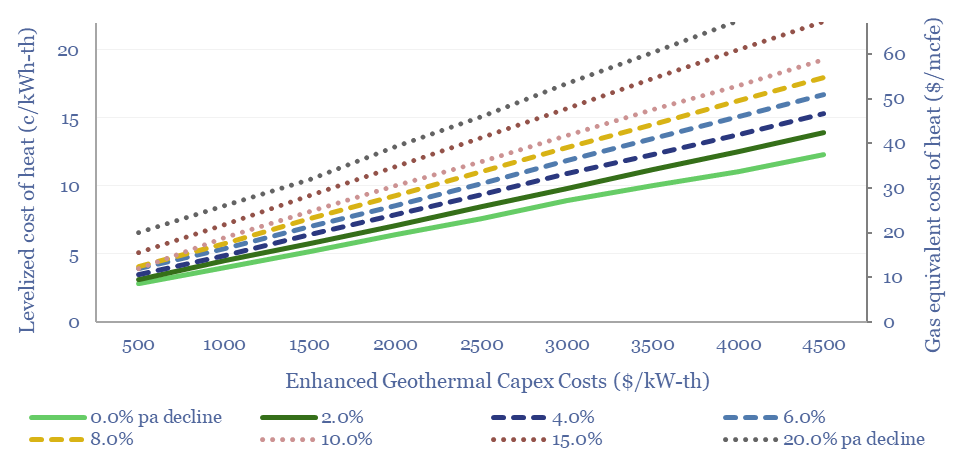
Geothermal energy costs are modelled from first principles in this data-file. LCOEs of 6c/kWh are available in geothermal hotspots. Outside of the hotspots, enhanced geothermal heat can cost 2-14c/kWh-th for a 10% IRR on $500-5,000/kW-th capex, while a rule of thumb is that geothermal electricity costs 5x geothermal heat.
Geothermal energy is produced from 200 geothermal fields globally, feeding 16GW of power capacity, generating around 110 TWH of useful electricity, which equates to 0.4% of the world’s electricity and 0.15% of its total useful energy.
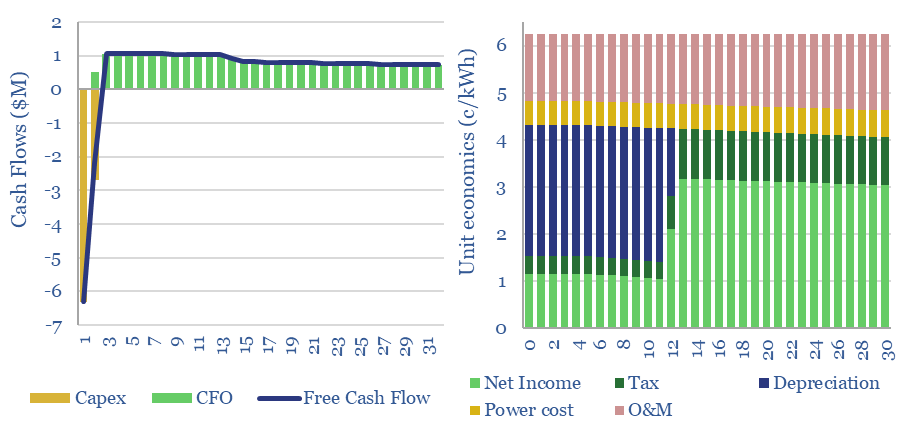
However this is almost all from geothermal hotspots (e.g., California, Indonesia, Philippines, Iceland), where hot fluids naturally well up to the surface. The levelized costs of geothermal electricity, in these hotspots, is 6c/kWh, as can be stress-tested in our model (chart below).
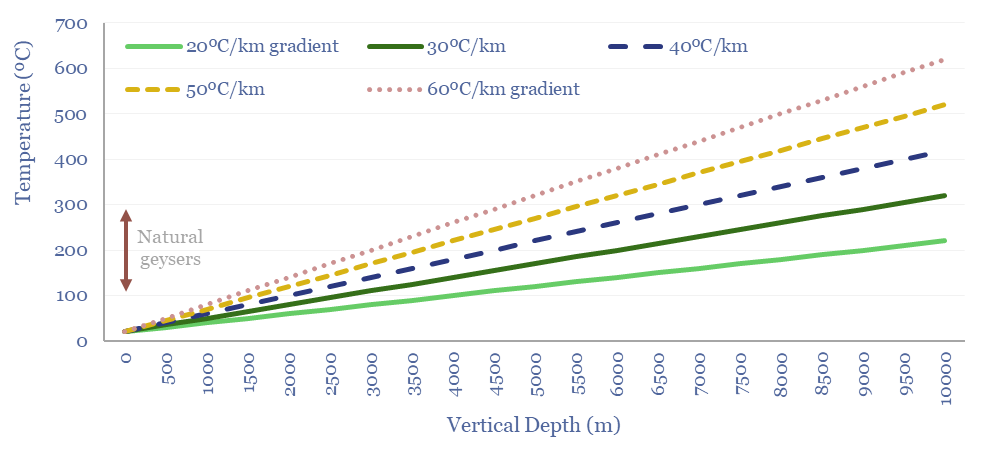
However, the average geothermal gradient globally is 25ºC per kilometer. Hence 100-300ºC temperatures are accessible by drilling deep wells, down to 3-10km total depth (chart below).
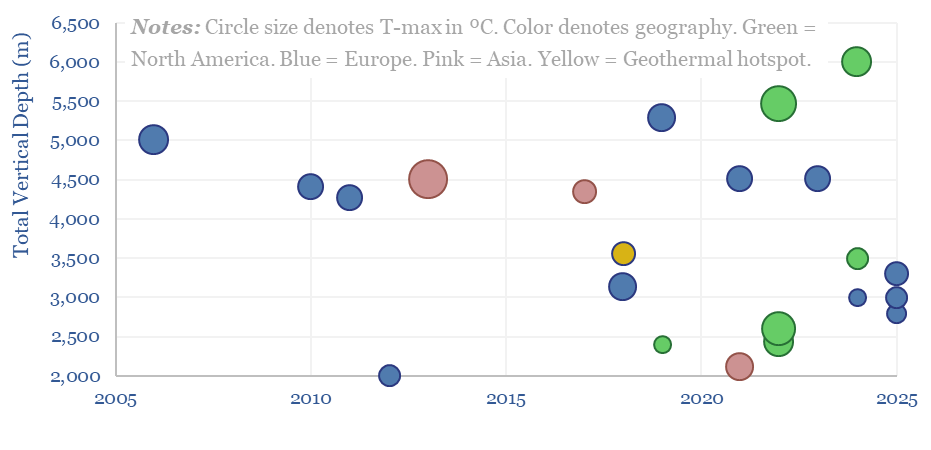
The pace of progress in enhanced geothermal has trebled in the past half-decade. This data-file contains a screen of over 20 enhanced geothermal pilots, tabulating their timings, total depth, bottom-hole temperatures, thermal capacity (in MW-th), electrical capacity (in MW-e), capex costs and other relevant details (chart below).
One factor that is hurting the economics of the geothermal power projects we have tabulated is that they are all small-scale pilots, with an average size of just 4MWe. We plot a line of best fit over the past data-points in the model. While it is always dangerous to extrapolate lines of best fit, we cannot resist doing this, as a simple ballparking exercise, to estimate where costs could end up at larger scale.
The levelized costs of enhanced geothermal are built up from first principles in the data-file, covering the costs of enhanced geothermal electricity, and enhanced geothermal heat. The capex costs for geothermal draw on our models, which capture the costs of drilling wells, heat exchangers and Organic Rankine Cycles.
Please download the data-file, to stress test geothermal energy costs, in hotspots (first tab), across geothermal electricity (second tab), geothermal heat (third tab), in other enhanced geothermal systems, and for other useful background data-points.
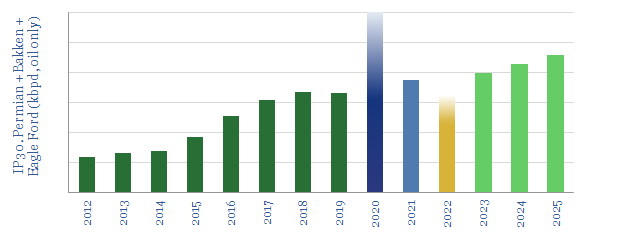
Unprecedented high-grading is now occurring in the US shale industry, amidst challenging industry conditions. This means 2020-21 production surprising to the upside, and we raise our forecasts +0.7 and +0.9Mbpd respectively. Conversely, when shale activity recovers, productivity could disappoint, and we lower our 2022+ forecasts by 0.2-0.9 Mbpd. This 7-page note explores the causes and consequences of this whipsaw effect.
Smart energy systemsare capable of transmitting and receiving real-time data and instructions. They open up new ways of optimizing energy efficiency, peak demand, appliances and costs. Over 100M smart meters and thermostats had been installed in the United States (including at c90M residences) and 250M have been installed in Europe by 2020.
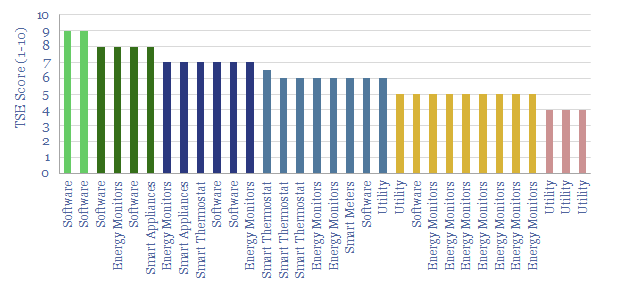
The purpose of this data-fileis to profile c40 companies commercializing opportunities in smart energy monitoring, smart metering and smart thermostats. The majority are privately owned, at the venture or growth stage. We also tabulate their patent filings.
We find most of the offeringswill lower end energy demand (by an average of 7%), assist with smoothing grid-volatility, provide appliance-by-appliance demand disaggregations and encourage consumers to upgrade inefficient or potentially even defective appliances. Numbers are tabulated in the data-file to quantify each of these effects.
Further research. Our recent commentary that summarises the key points on Smart energy systems is linked here. Our outlook on the most conductive metals used in the energy transition is linked here.
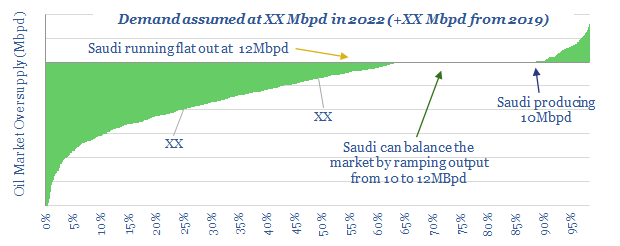
Oil prices must entrench well above $50/bbl for 2023-25 oil markets to balance. But prices could materially overshoot. This short 4-page note presents our latest conclusions, and top charts on oil supply-demand, including our outlook to 2025.
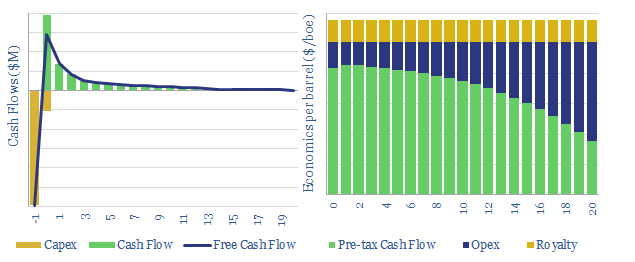
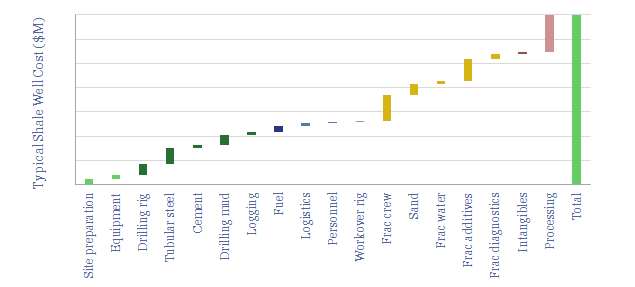
This data-model breaks down the economics of US shale, in order to calculate NPVs, IRRs and oil price break-evens of future drilling in major US basins (predominantly the Permian, but also Bakken and Eagle Ford).
Our base case conclusionis that a $40/bbl oil price is required for a 10% IRR on a $7.0M shale well with 1.0 kboed of IP30 production. Break-evens mostly vary within a range of $35-50/bbl. They are most sensitive to productivity, which can genuinely unlock triple-digit IRRs, even at $40/bbl.
Underlying the analysisis a granular model of capex costs, broken down across 18 components (chart below). Shale economics are calculated off of input variables such as rig rates, frac crew costs, diesel prices, sand prices, tubular steel prices, cement prices and other more niche services.
Stress-testing the model. You can flex input assumptions in the ‘NPV’ and ‘CostBuildUp’ tabs of the model, in order to assess economic consequences. For a similar model of shale gas, please see our model here.
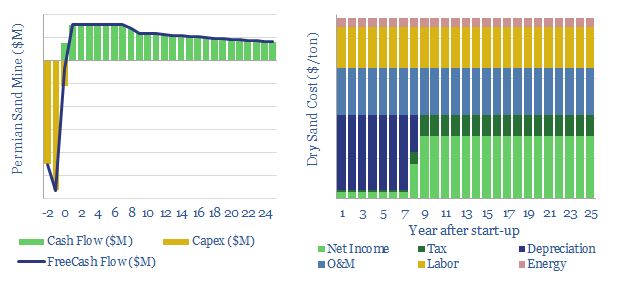
This model is a very simple breakdown of economics for in-basin sand production, around the US shale industry. We estimate the price that must be charged at the mine gate for a typical facility to make a 10% return.
The model can also be used to quantify the potential savings from shifting from dry sand to wet sand, estimated at c25% of total costs.
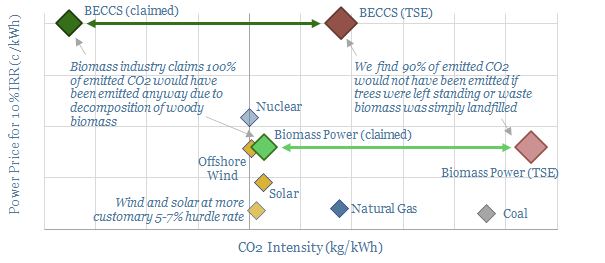
20% of Europe’s renewable electricity currently comes from biomass, mainly wood pellets, burned in facilities such as Drax’s 2.6GW Yorkshire plant. But what are the economics and prospects for biomass power as the energy transition evolves? This 18-page analysis leaves us cautious.
Cookies?
This website uses necessary cookies. Our cookies are simply to improve your experience. We do not undertake any advertising or targeting via our cookies. By clicking 'accept' or continuing to use the website, you consent to our use of cookies.AcceptRead More
Privacy & Cookies Policy
Privacy Overview
This website uses cookies to improve your experience while you navigate through the website. Out of these, the cookies that are categorized as necessary are stored on your browser as they are essential for the working of basic functionalities of the website. We also use third-party cookies that help us analyze and understand how you use this website. These cookies will be stored in your browser only with your consent. You also have the option to opt-out of these cookies. But opting out of some of these cookies may affect your browsing experience.
Necessary cookies are absolutely essential for the website to function properly. This category only includes cookies that ensures basic functionalities and security features of the website. These cookies do not store any personal information.
Any cookies that may not be particularly necessary for the website to function and is used specifically to collect user personal data via analytics, ads, other embedded contents are termed as non-necessary cookies. It is mandatory to procure user consent prior to running these cookies on your website.