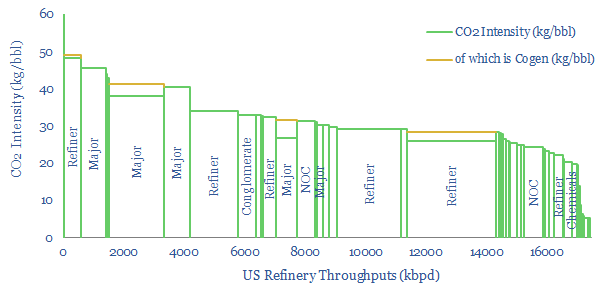
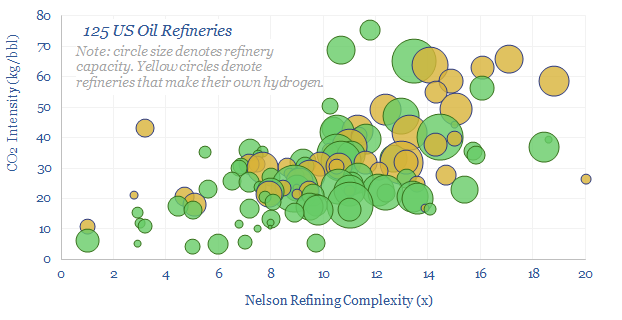
This US refinery database covers 125 US refining facilities, with an average capacity of 150kbpd, and an average CO2 intensity of 33 kg/bbl. Upper quartile performers emitted less than 20 kg/bbl, while lower quartile performers emitted over 40 kg/bbl. The goal of this refinery database is to disaggregate US refining CO2 intensity by company and by facility.
Every year, the c125 core refineries in the US, with c18Mbpd of throughput capacity report granular emissions data to the US EPA. The individual disclosures are something of a minefield, and annoyingly lagged. But this refinery database is our best attempt to tabulate them, clean the data and draw meaningful conclusions.
Some of the larger companies assessed in the data-file include Aramco, BP, Chevron, Citgo, Delek, ExxonMobil, Koch, HF Sinclair, Marathon, Phillips66, PBF, Shell and Valero.
The average US refinery emits 33kg of direct CO2 per barrel of throughputs, we estimate, with a 10x range running from sub-10 kg/bbl to around 100 kg/bbl (chart below).
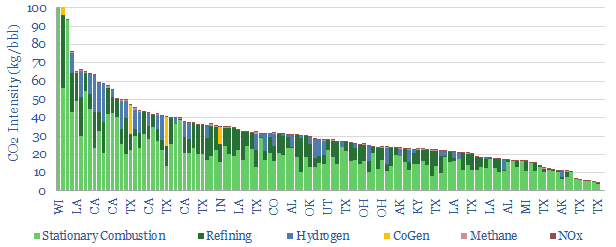
Breakdown of direct US refinery emissions? The 33 kg/bbl average CO2 intensity of US refineries comprises 20 kg/bbl of stationary combustion, 8 kg/bbl of other refining processes, 3 kg/bbl of on-site hydrogen generation, 1 kg/bbl of cogeneration, 0.2 kg/bbl associated with methane leaks.
Some care is needed in interpreting the data. Refineries that are more complex, make cleaner fuels, make their own hydrogen (rather than buying merchant hydrogen) and also make petrochemicals are clearly going to have higher CO2 intensities than simple topping refineries. There is a 50% correlation between different refineries’ CO2 intensity (in kg/bbl) and their Nelson Complexity Index.
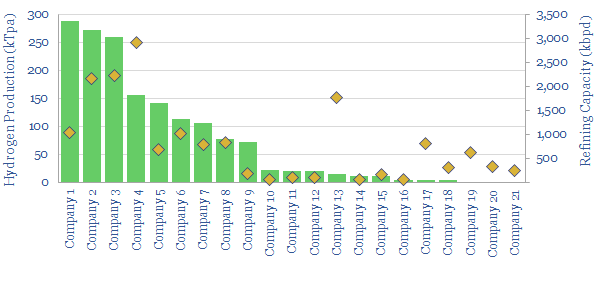
Which refiners make their own hydrogen versus purchasing merchant hydrogen from industrial gas companies? This question matters, as hydrogen value chains come into focus. Those who control the Steam Methane Reformers may be readily able to capture CO2 in order to earn $85/ton cash incentives under the IRA’s reformed 45Q program, as discussed in our recent research note into SMRs vs ATRs. One SuperMajor and two pure play refiners stand out as major hydrogen producers, each generating 250-300kTpa of H2.
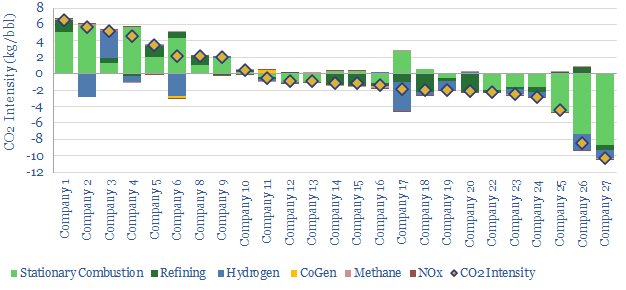
How has the CO2 intensity of US refineries changed over the past 3-years? The overall CO2 intensity is unchanged. However, some of the most improved refineries have lowered their CO2 intensities by 2-10 kg/bbl (chart below). Conversely, some Majors have seen their CO2 intensities rise by 2-7 kg/bbl.
For further context and ideas, we have also published summaries of our key conclusions into downstream, vehicles and long-term oil demand. All of our hydrocarbon research is summarized here.
The full refinery database contains a granular breakdown, facility-by-facility, showing each refinery, its owner, its capacity, throughput, utilisation rate and CO2 emissions across six categories: combustion, refining, hydrogen, CoGen, methane emissions and NOx (chart below). The data-file was last updated in 2023 and covers the full US refinery landscape in 2018, 2019 and 2021, going facility by facility, and operator by operator.

