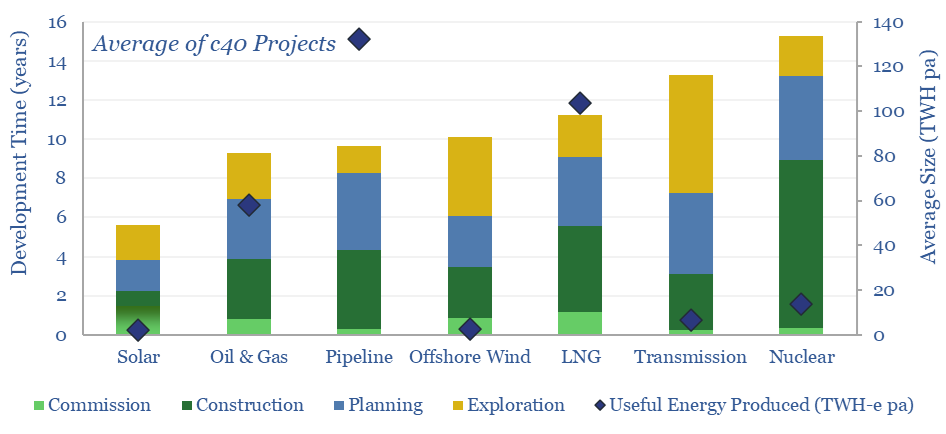
Energy development times average c4-years for solar projects, 6-years for wind, 7-years for oil, gas, pipelines, LNG, 13-years for nuclear, while infrastructure such as gas pipelines and power transmission lines…
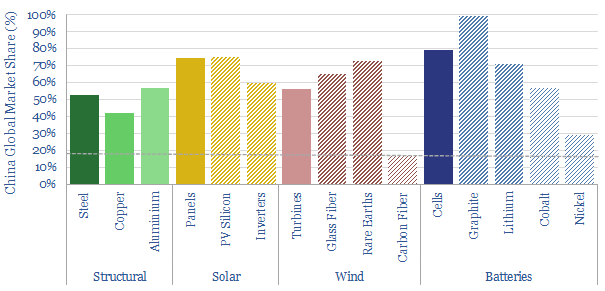
China is 18% of the world’s people and GDP. But it makes c50% of the world’s metals, 60% of its wind turbines, 70% of its solar panels and 80% of…
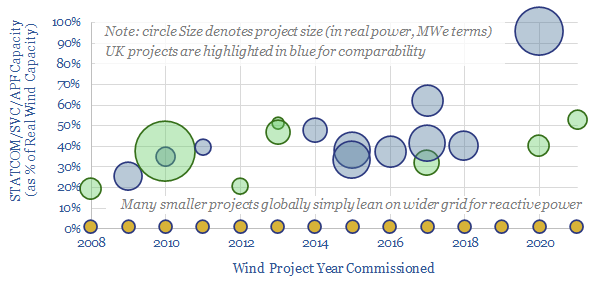
Wind and solar have so far leaned upon conventional power grids. But larger deployments will increasingly need to produce their own reactive power; controllably, dynamically. Demand for STATCOMs & SVCs…
…surrender 30-50% of the PV silicon as ‘kerf’ sawdust. $399.00 – Purchase Checkout Added to cart This should improve the manufacturing efficiency, module efficiency and energy intensity of solar PV, and possibly…
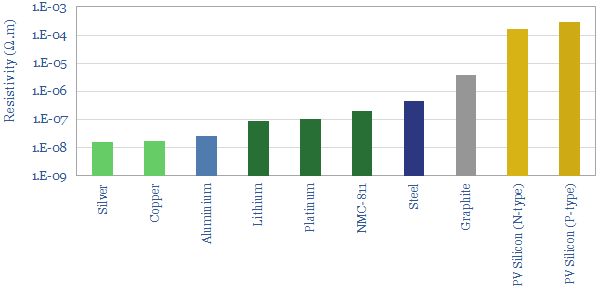
…high stability, to make it the most commonly used front contact material in solar cells, which in turn consume around 10% of global silver production today. Copper is used in…
Gold and silver are stores of value, especially in a world of persistently high inflation and low rates. Silver is also likely to be the main bottleneck for solar in…
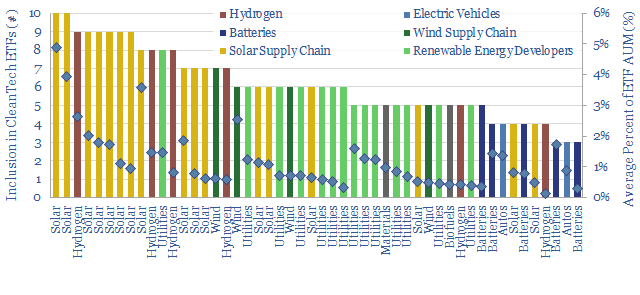
…transition ETFs on average. Predictable sectors. Of these top 50 companies, 17 are solar companies, from around the solar supply chain. 14 are renewable energy developers. 6 are hydrogen or…
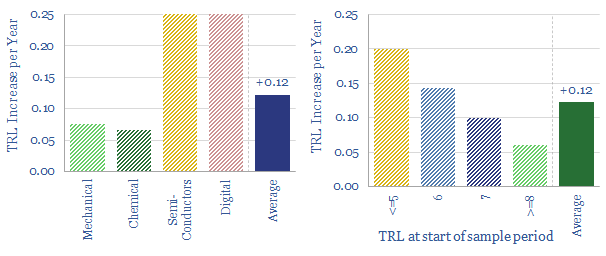
…maybe even depressed us, is how slowly many have progressed. Energy technologies considered in the note include blue hydrogen, SiC power MOSFETs, hydrogen vehicles, TOPCon solar, remote working, plastic pyrolysis,…
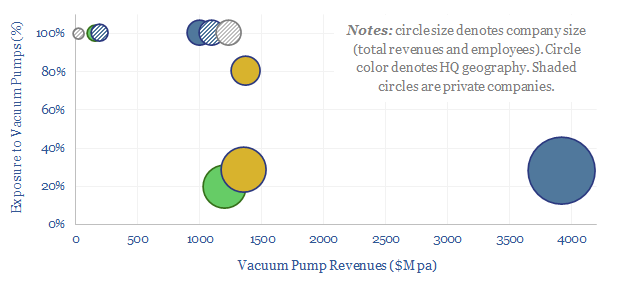
The global market for vacuum pumps is worth $15bn per year, with growing importance for making semiconductors, solar panels and AI chips. This data-file reviews ten leading companies in vacuum…
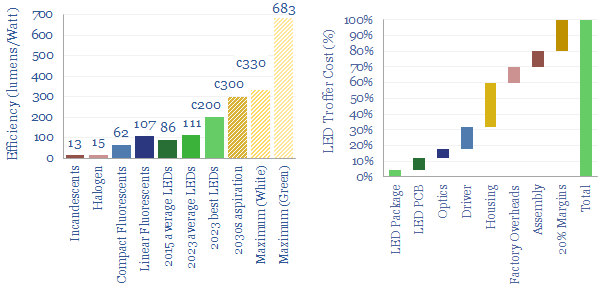
…the energy transition. We think LED market share doubles to c100% in the 2030s, to save energy, especially in solar-heavy grids. But demand is also rising due to ‘rebound effects’…