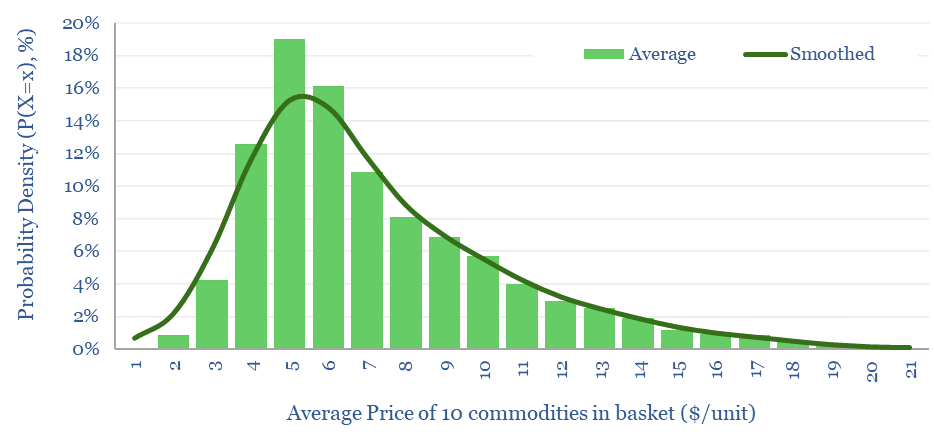
…errors average 50%, while more volatile prices have more upside skew. $499.00 – Purchase Checkout Added to cart This data-file contains data plotting the statistical distributions of volatility for twelve major commodities,…
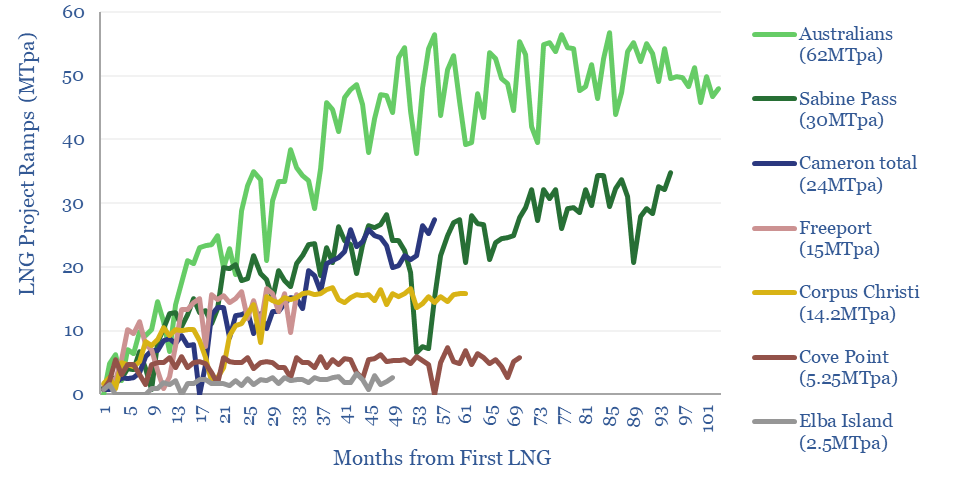
What are the typical ramp-rates of LNG plants, and how volatile are these ramp-ups? We have monthly data on several facilities in our LNG supply-demand model, implying that 4-5MTpa LNG…
UK wind power has almost trebled since 2016. But its output is volatile, now varying between 0-50% of the total grid. Hence this 14-page note assesses the volatility, using granular,…
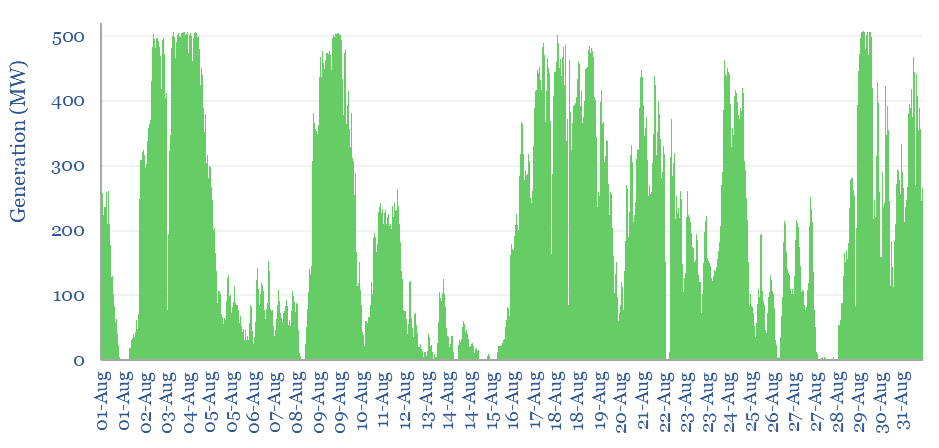
…suggests that wind is being curtailed when the grid is already full of solar. Short-term volatility also appears to be higher for wind than for solar. The 5-minute-by-5-minute volatility of…
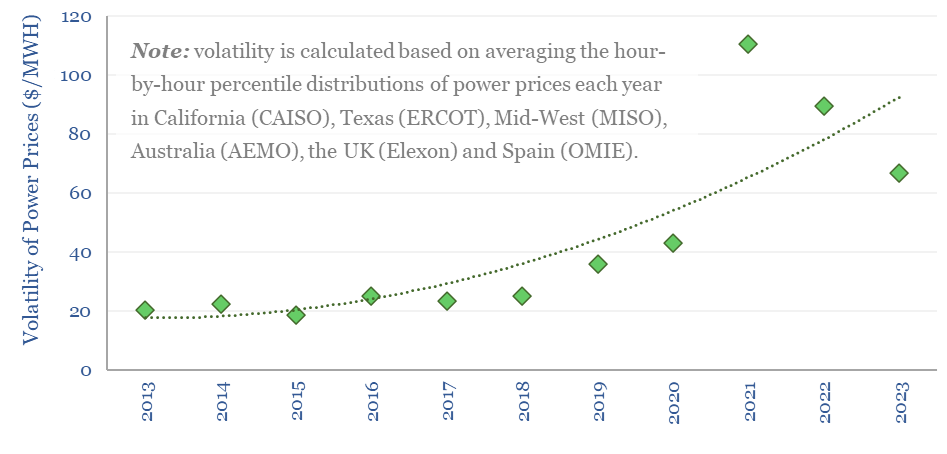
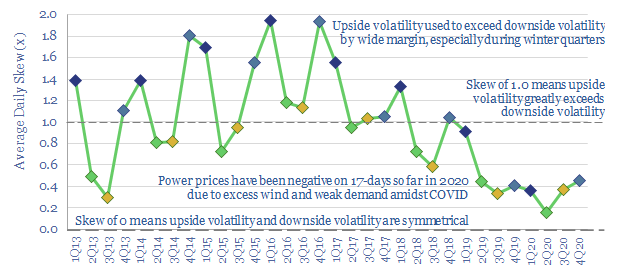
…California, US MidWest, Australia, the UK and Spain), as a way of tracking increases in global power price volatility. $599.00 – Purchase Checkout Added to cart The growing volatility of power grids…
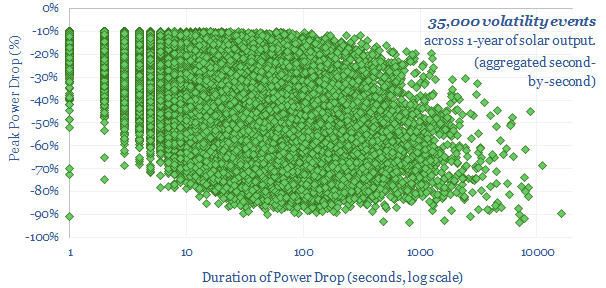
…the power drops due to the sun setting. Then we aggregated all of the second-by-second volatility and power drops. The typical second-by-second volatility of solar power is surprisingly high, with…
…renewables is volatile. The volatility of solar includes around 100 volatility events per day. The volatility of wind includes around 75 volatility events per day. This is usually fine, as…
…cart Renewable output is volatile. Solar generation is volatile. Wind generation is volatile. The volatility spans from second-to-second volatility, through to minute-by-minute, hour-by-hour, day-by-day, season-by-season and even year-by-year. Demand shifting…
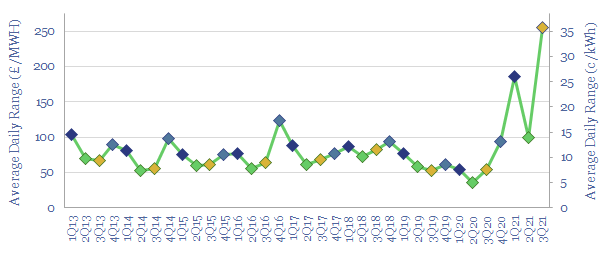
…So will the high volatility persist? This is the question in today’s 6-page note. We attribute two-thirds of the volatility gains to gas shortages and high absolute power prices. However,…
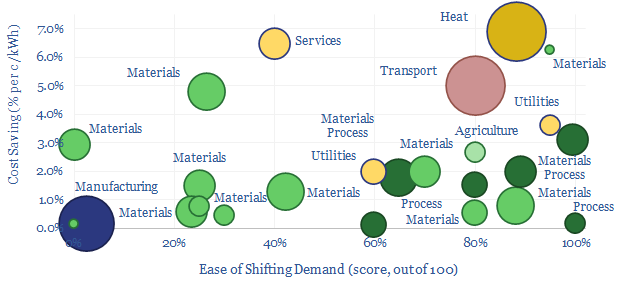
Some industries can absorb low-cost electricity when renewables are over-generating and avoid high-cost electricity when they are under-generating. The net result can lower electricity costs by 2-3c/kWh and uplift ROCEs…