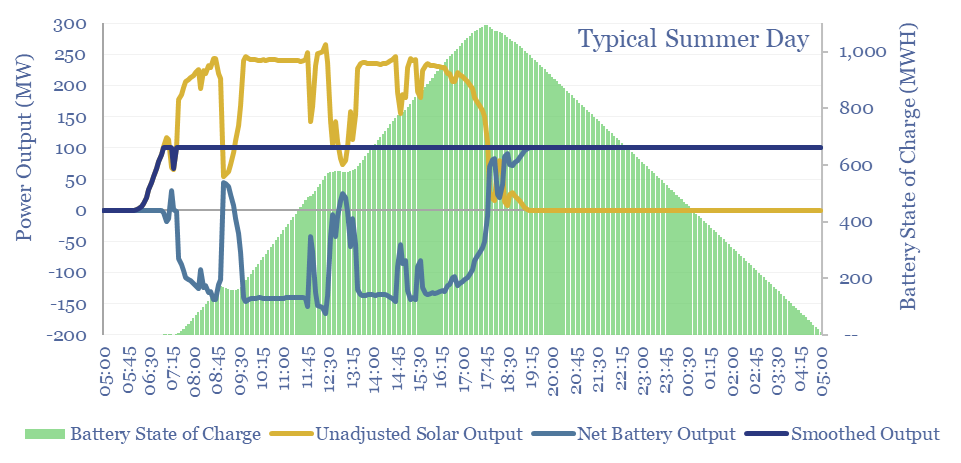
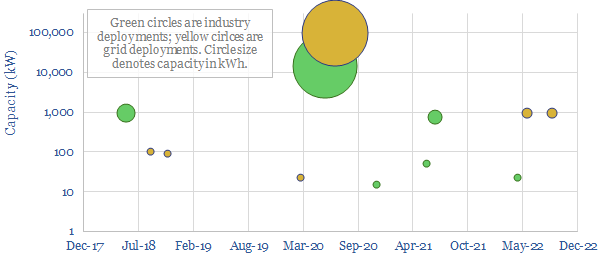
Solar+battery co-deployments allow a large and volatile solar asset to produce a moderate-sized and non-volatile power output, during c40-50% of all the hours throughout a typical calendar year. This smooth…
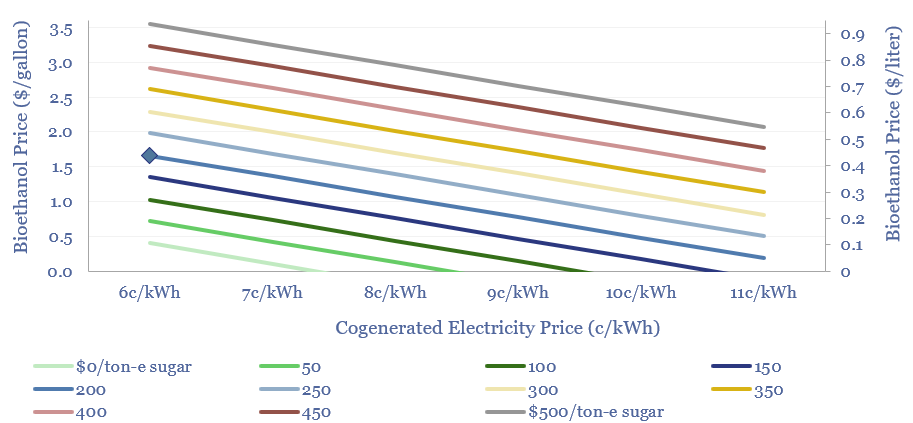
…and cogenerated power. This 11-page note argues that more volatile electricity prices could halve ethanol costs or raise cash margins by 2-4x. $499.00 – Purchase Checkout Added to cart Global biofuels production…
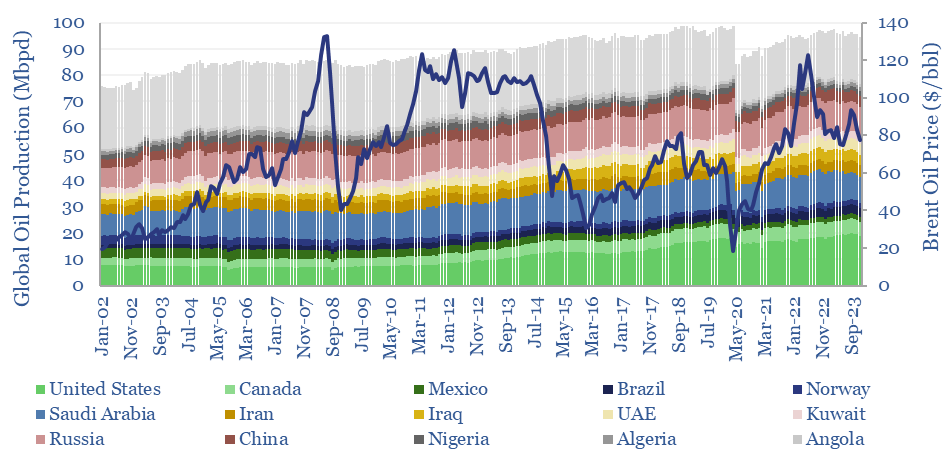
…Arabia, Kuwait, UAE, the US, Canada and Russia very clearly adapt their growth/output to market pricing signals, which actually dampens down supply volatility. Countries with the highest volatility in their…
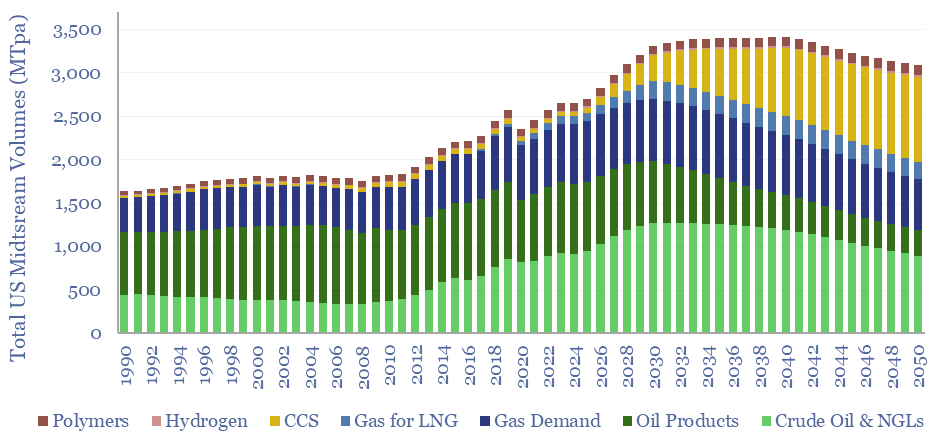
…in the global energy industry, due to the inherent volatility of solar and wind. Rising volatility increases the value of midstream infrastructure, which by definition, can arbitrage the volatility by…
…work is that we recently evaluated the second-by-second volatility of solar and wind output, which incur 80-100 volatility events per day, of which c70-80% last less than 60-seconds. In turn,…
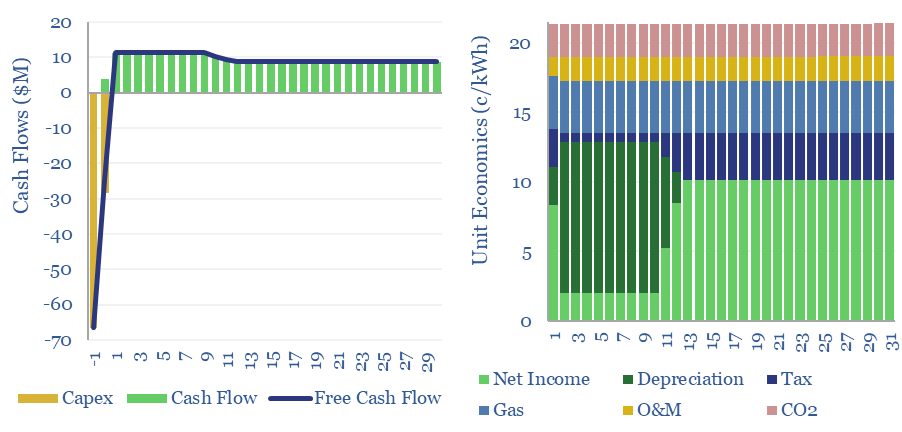
…pricing volatility. A fascinating observation is that each 1 c/kWh increase in power grid volatility increases peaker plant cash flows by $6/kW/year. Each 1pp reduction in utilization rate lowers cash…
…with gas would have required the equivalent of 40MTpa of LNG imports, over 10% of overnight tightening in global LNG market. Philosophical problem #1: historical volatility? Commodity prices volatility raises…
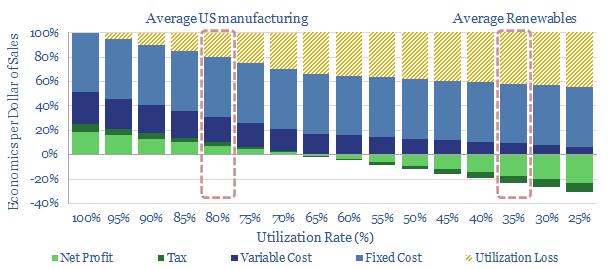
…chemicals and metals facilities. This is not always entirely consistent with being fully powered by volatile wind and solar. $299.00 – Purchase Checkout Added to cart Renewables will ramp up to 25%…
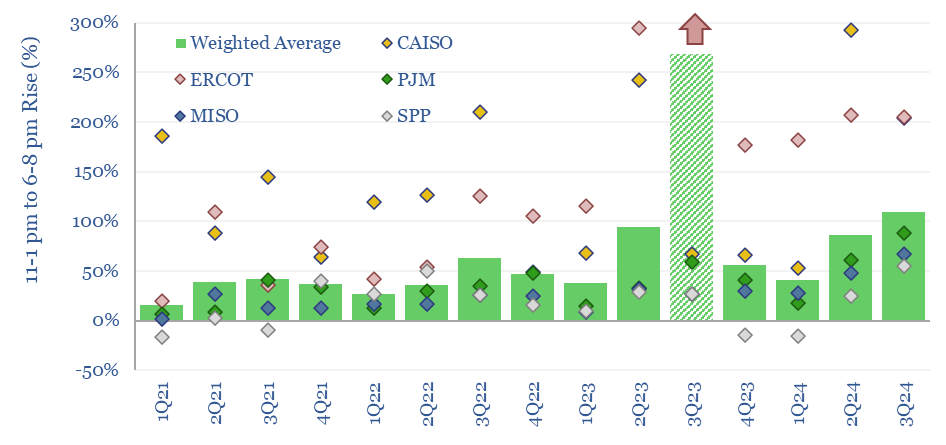
…show a more volatile pattern for CAISO, with strong seasonal effects, and more volatility. Perhaps duckiness has also been muted by a large battery build-out, doubling every year, with batteries…
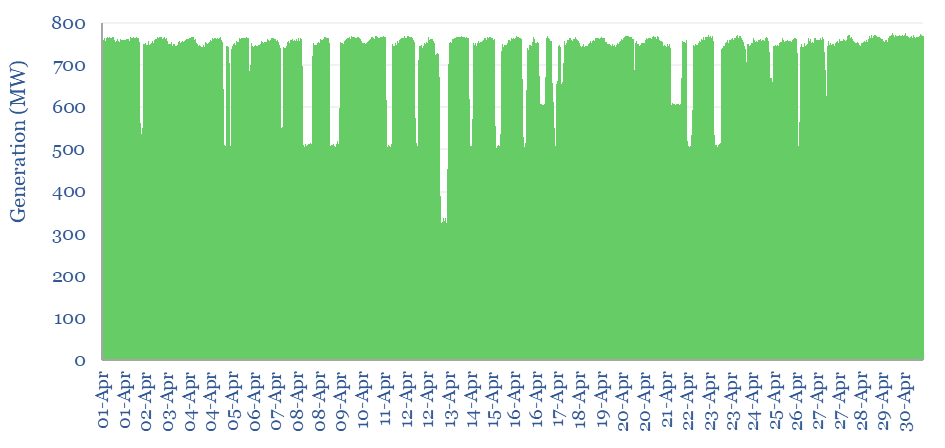
…design. The average 5-minute-by-5-minute volatility of Kogan Creek is +/-1%, while a typical large solar or wind installation is +/- 5%. For wind and solar, this is true volatility. But…


