Search results for: “demand model”
-
Global energy demand: by region and through 2050?
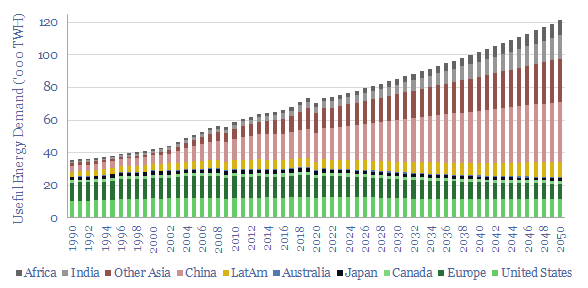
This model captures global energy demand by region through 2050, rising from 70,000 TWH in 2019-22 to 120,000 MWH in 2050. Demand rises c2% pa. Energy use per global person rises at 1% pa from 9.3 MWH pp pa to 12.6 MWH pp pa. Meeting human civilization’s energy needs is crucial to the energy transition.
-
US decarbonization: energy and CO2 emissions?
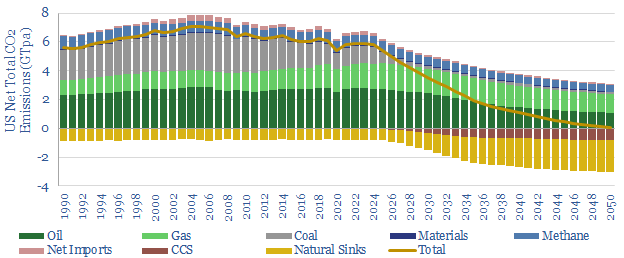
The US consumes 25,000 TWH of primary energy per year, which equates to 13,000 TWH of useful energy, and emits 6GTpa of CO2. This model captures our best estimates for what a pragmatic and economical decarbonization of the US will look like, reaching net zero in 2050, with forecasts for wind, solar, nuclear, hydro, oil,…
-
Data-centers: electricity use and demand shifting?
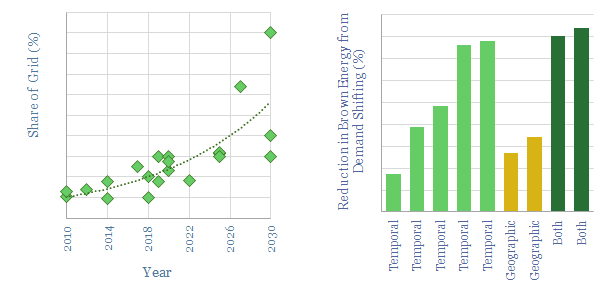
This data-file estimates data-centers’ electricity use and ability to demand shift. Large data centers how power demand in the range of 50-500MW. Around 40% of their electrical loads can demand shift, to help smooth out the volatility of renewables?
-
Copper: global demand forecasts?
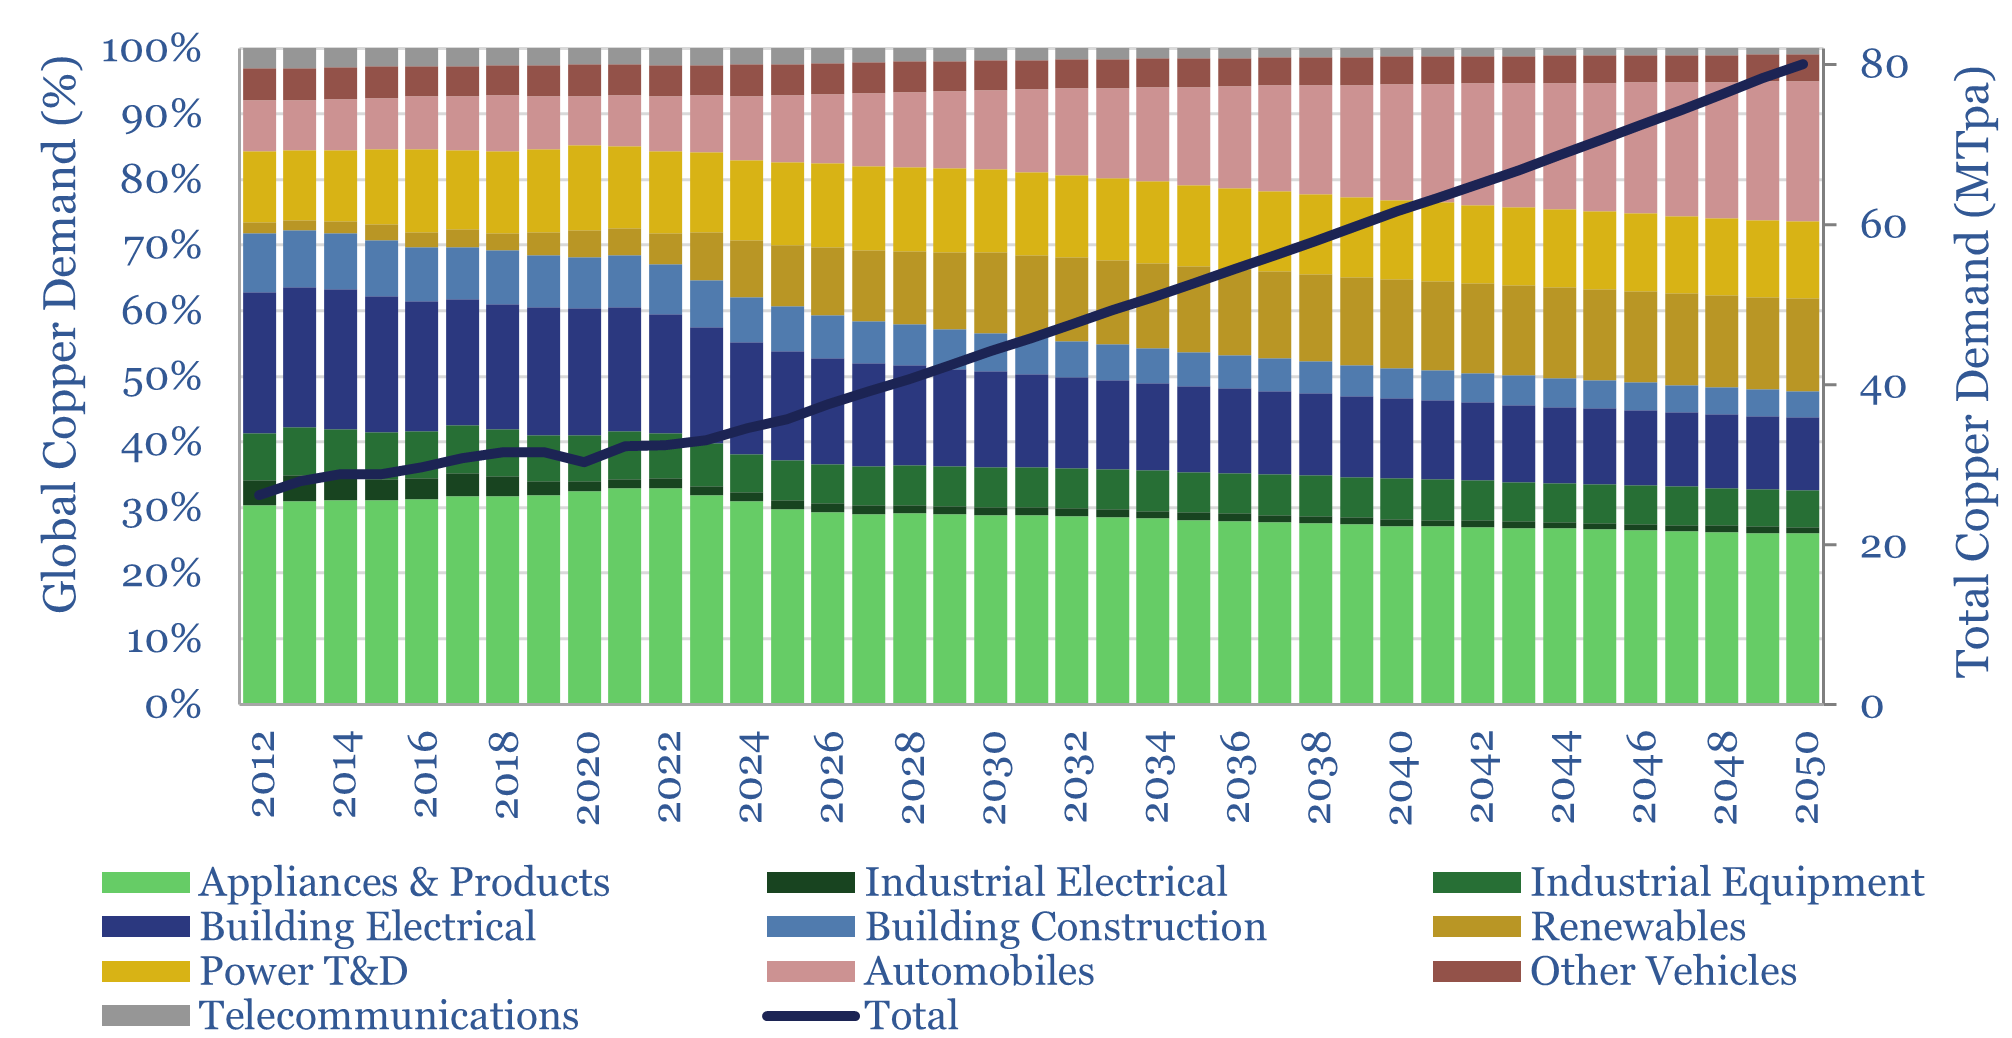
This data-file estimates global copper demand as part of the energy transition, rising from 33MTpa in 2023 to 44MTpa in 2030 and 80MTpa by 2050. Key demand drivers are solar, EVs, greater AC adoption and possibly drones and robotics. You can stress test half-a-dozen key input variables in the model.
-
Japan oil demand: breakdown over time?
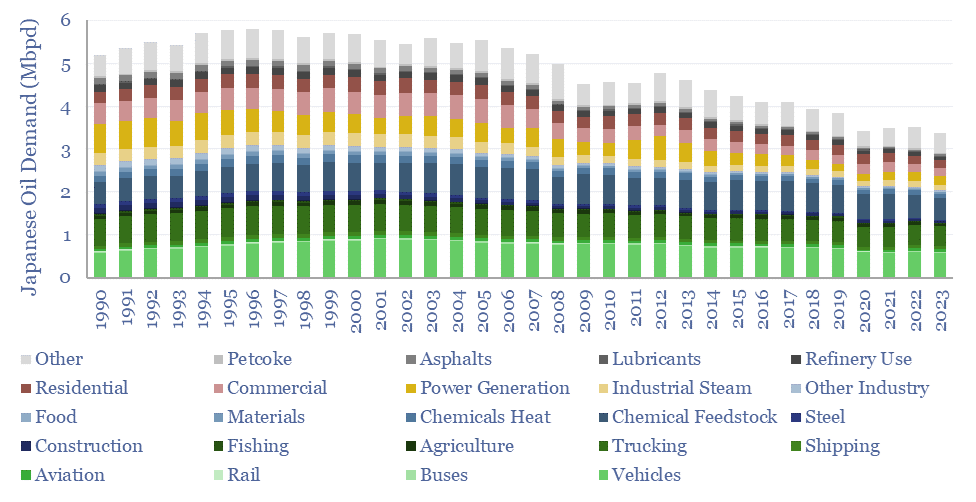
Japan’s oil demand peaked at 5.8Mbpd in 1996, and has since declined at -2.0% per year to 3.4Mbpd in 2023. To some, this trajectory may be a harbinger of events to come in broader global oil markets? While to others, Japan has unique features that do not generalize globally? Hence this report and data-file…
-
Commodity demand: how sensitive to GDP growth?
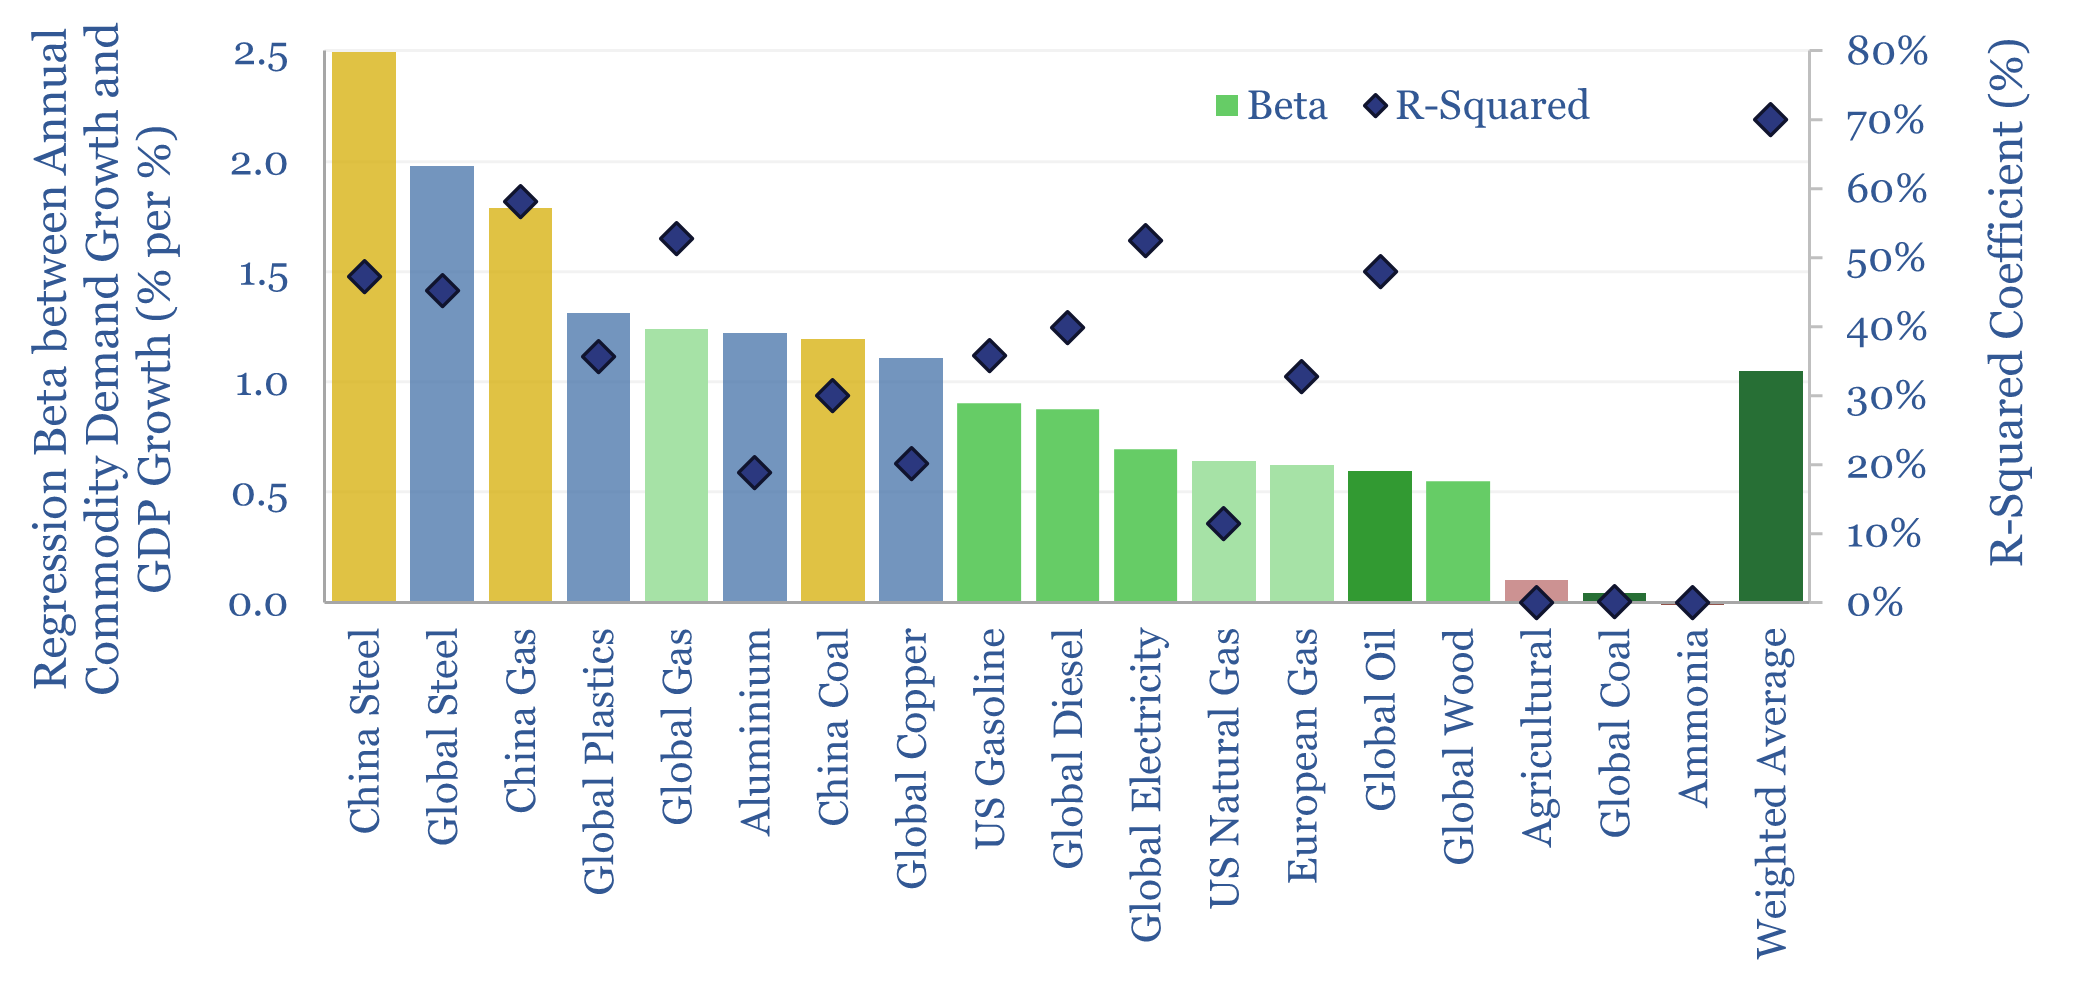
How sensitive is global commodity demand to GDP growth? This 15-page report runs regressions for 25 commodities. Slower GDP growth matters most for oil markets, which are entering a new, more competitive, era. China is also slowing. But we still see bright spots in gas, metals, materials in our 2025 commodity outlook.
-
COVID-19 Impacts on US Gasoline Demand?
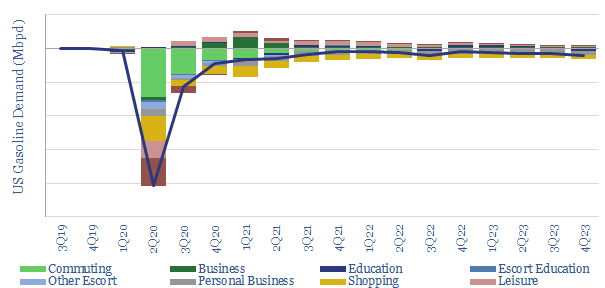
US gasoline is the largest component of global oil demand, at c9% of the market. Hence we have modelled the disruption from COVID-19. -2Mbpd of YoY demand destruction is not inconceivable. But when the market turns, it may also recover very quickly.
-
Residential energy consumption over time?
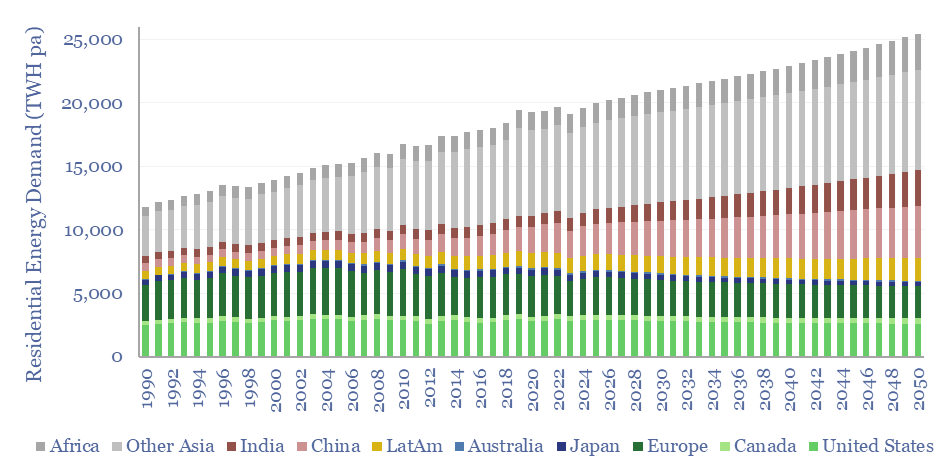
Global residential energy demand runs at 2.5 MWH pp pa, of which c40% is from electricity, 40% is gas, c13% is biomass and c7% is oil. In our gas and power models, electrification rises to 65% by 2050, to help renewables reach 50% of global electricity. Heat pumps improve efficiency and lower primary demand in the developed world.
-
US electricity demand: by sector, by use, over time?
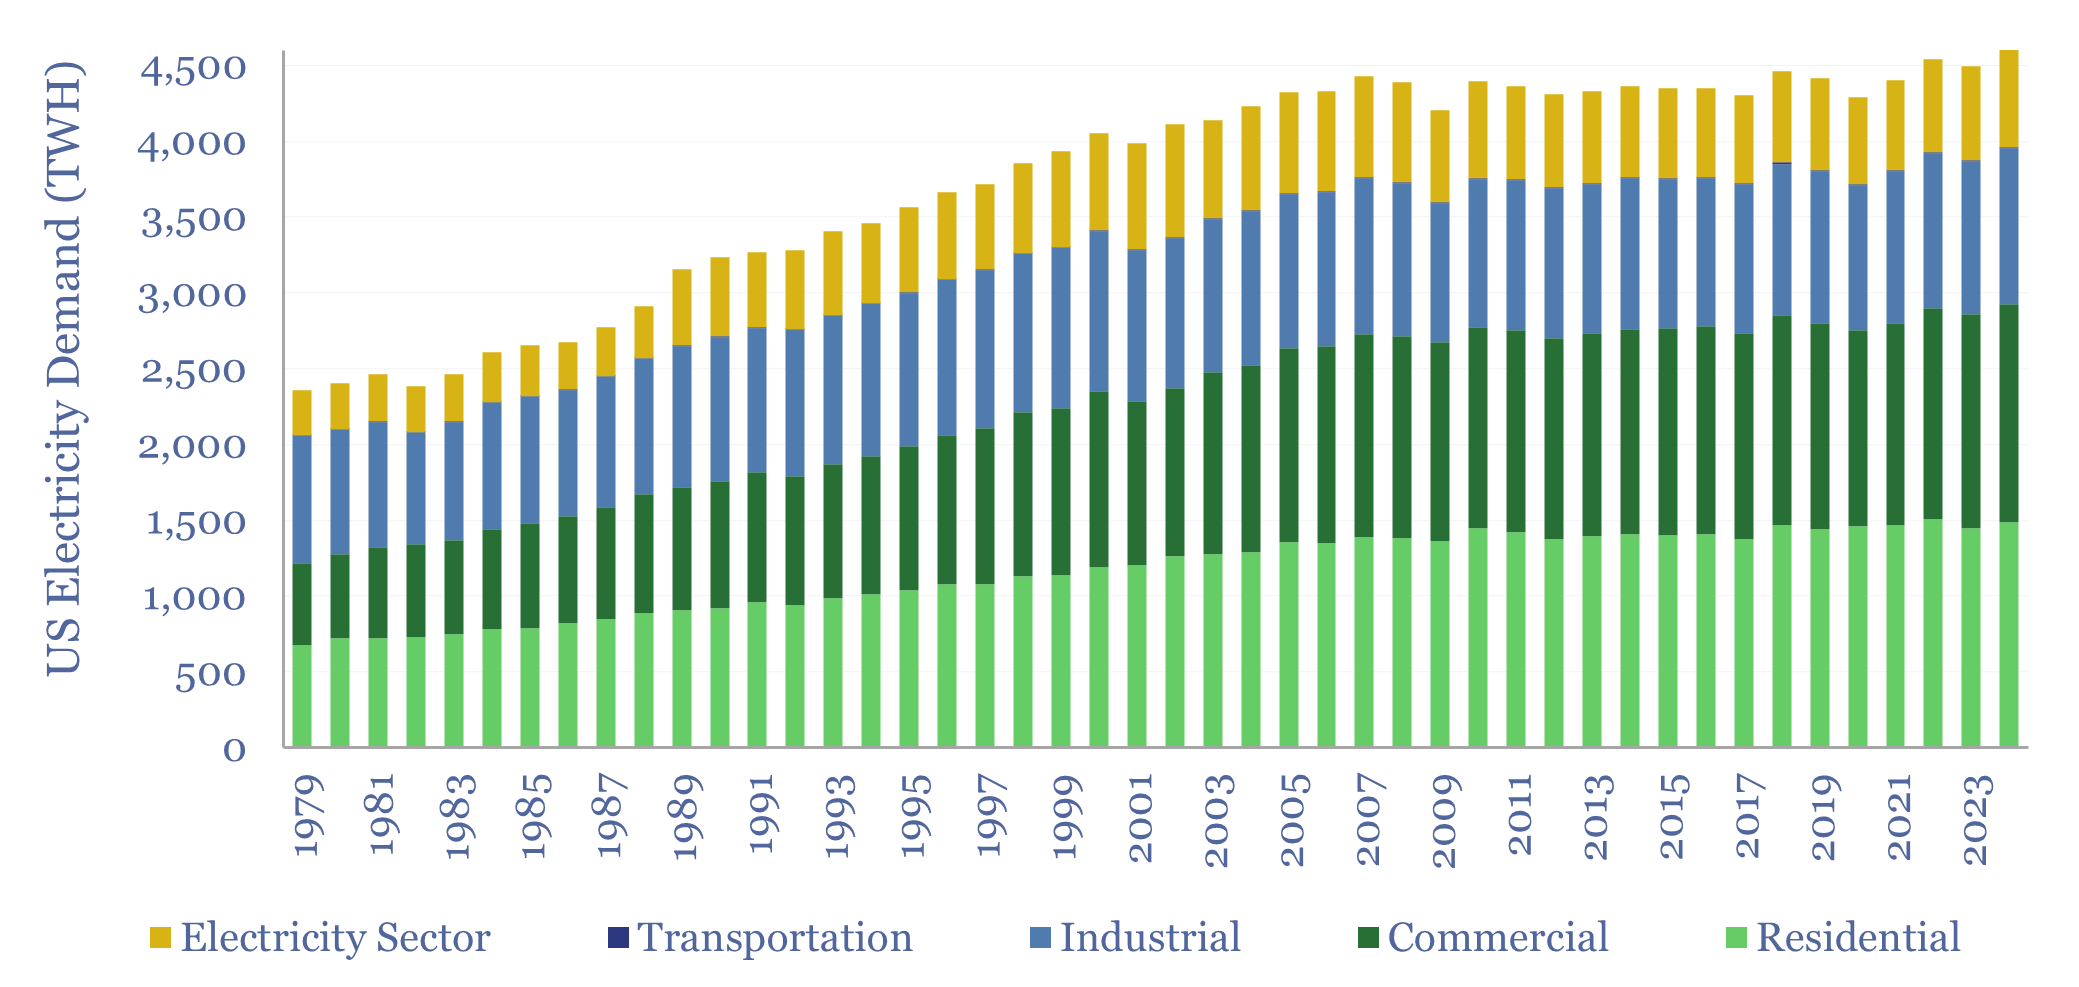
US electricity sales reached 4,000 TWH in 2024, rising +2.3% YoY, and bringing the trailing ten-year CAGR to 0.5% pa. The current breakdown is 38% residential, 36% commercial, 26% industrial. All three are now growing. To help understand load growth, this data-file is a breakdown of US electricity demand by sector, by use and over…
-
Electricity demand for electric vehicles?
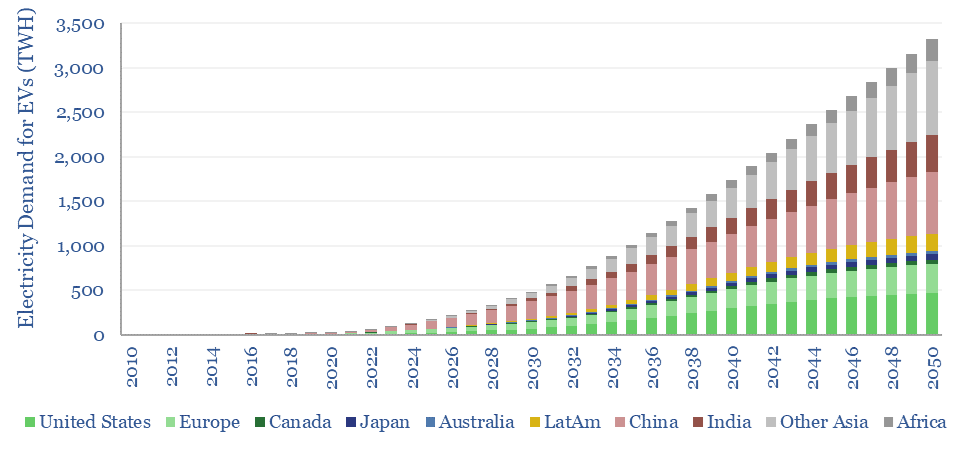
Global electricity demand for electric vehicles will rise from 120TWH in 2024 to 500 TWH in 2030 and 3,300 TWH in 2050, ultimately adding 11% upside to today’s global electricity demand, as part of our roadmap to net zero. This data-file quantifies electricity demand for EVs by region and over time, including data into the…
Content by Category
- Batteries (89)
- Biofuels (44)
- Carbon Intensity (49)
- CCS (63)
- CO2 Removals (9)
- Coal (38)
- Company Diligence (94)
- Data Models (838)
- Decarbonization (160)
- Demand (110)
- Digital (59)
- Downstream (44)
- Economic Model (204)
- Energy Efficiency (75)
- Hydrogen (63)
- Industry Data (279)
- LNG (48)
- Materials (82)
- Metals (80)
- Midstream (43)
- Natural Gas (148)
- Nature (76)
- Nuclear (23)
- Oil (164)
- Patents (38)
- Plastics (44)
- Power Grids (130)
- Renewables (149)
- Screen (117)
- Semiconductors (32)
- Shale (51)
- Solar (68)
- Supply-Demand (45)
- Vehicles (90)
- Wind (44)
- Written Research (354)