Search results for: “hydro”
-
US energy consumption by State and by source?
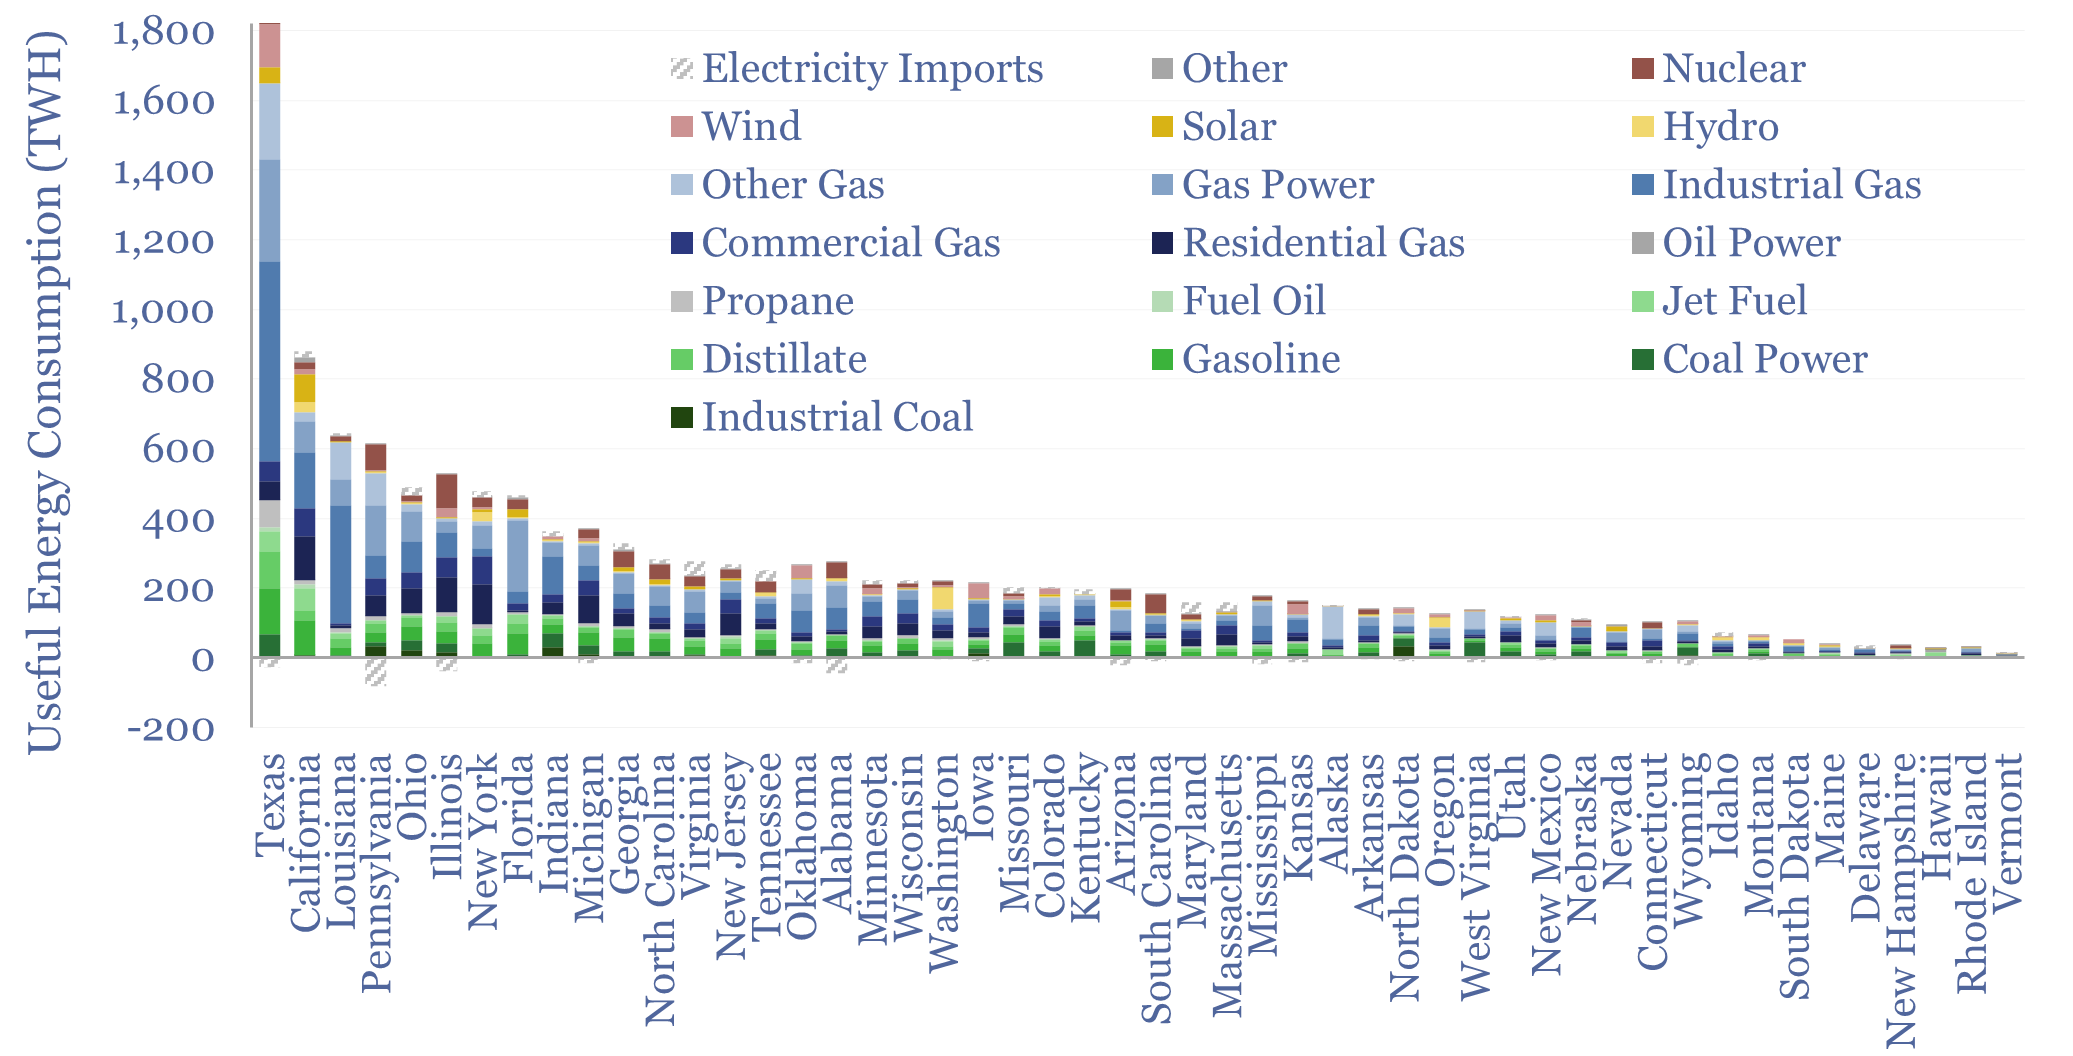
Total useful energy consumption in the US runs at 12,500 TWH pa, or 37 MWH pp pa. But this data-file disaggregates useful US energy consumption by State and by energy source, from 2000 to 2024. The US energy system is not a monolith, but full of amazing regional variation.
-
Verdox: DAC technology breakthrough?
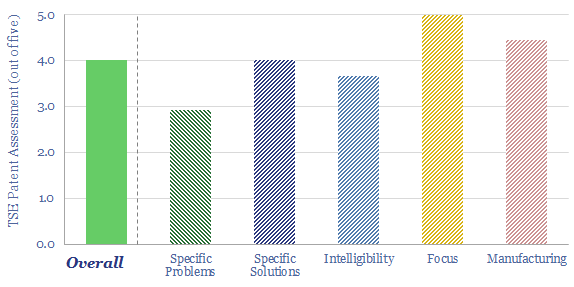
This data-file reviews Verdox DAC technology, optimizing polyanthraquinones and polynaphthoquinones, then depositing them on porous carbon nano-tube scaffolds. These quinones are shown to selectively adsorb CO2 when a voltage is applied, then desorb them when a reverse voltage is applied, unlocking 70% lower energy penalties than incumbent DAC?
-
Storage tank costs: storing oil, energy, water and chemicals?
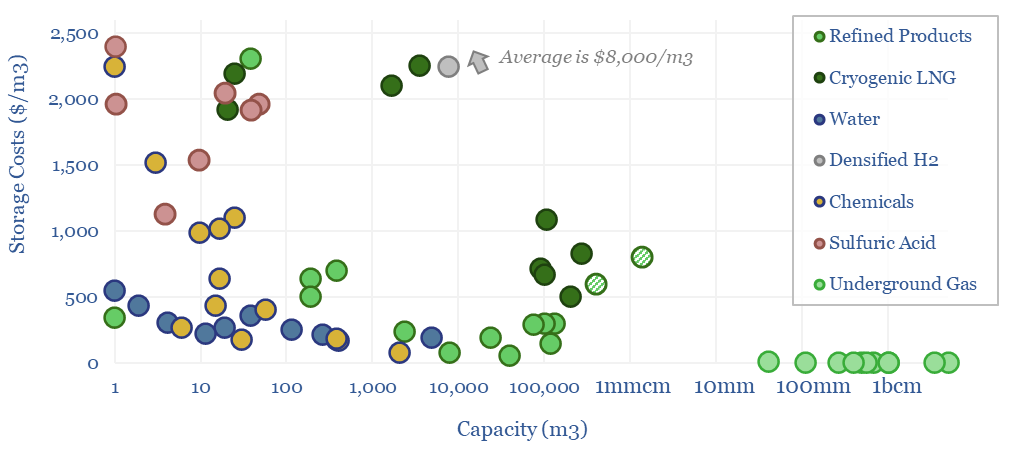
Storage tank costs are tabulated in this data-file, averaging $100-300/m3 for storage systems of 10-10,000 m3 capacity. Costs are 2-10x higher for corrosive chemicals, cryogenic storage, or very large/small storage facilities. Some rules of thumb are outlined below with underlying data available in the Excel.
-
Wind and solar: what CO2 abatement costs of renewables?
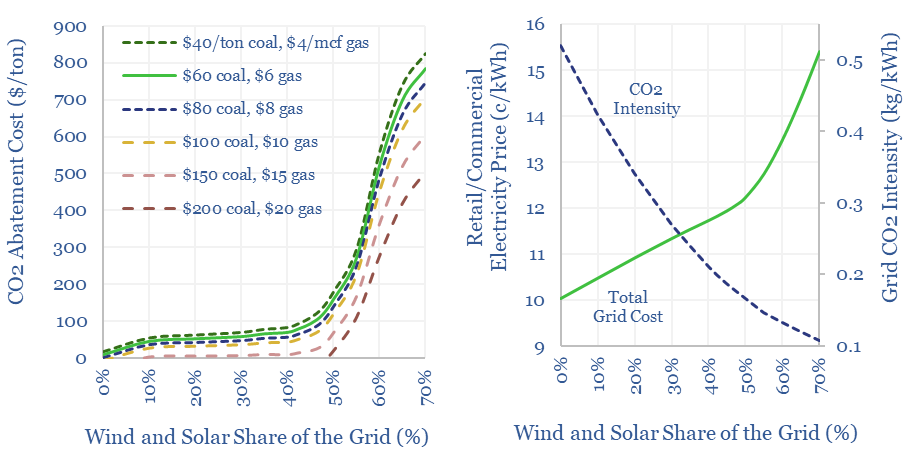
The costs of decarbonizing by ramping up solar and wind are highly dependent on context. The purpose of this data-file is to enable stress-testing of the CO2 abatement costs of renewables, in different contexts and at different grid penetrations. Our own estimate is that solar and wind can reach 40% of the global grid for…
-
LNG plant compression: gas drives vs electric motors?
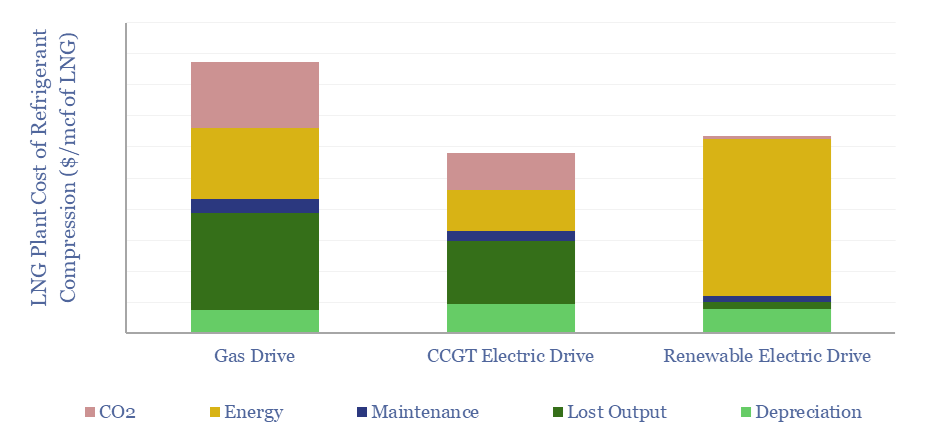
This data-file compares the costs of refrigerant compression at LNG plants, using gas turbines, electric motors powered by on-site CCGTs, or electric motors powered by renewable electricity. eLNG has higher capex costs, but higher efficiency, lower opex, and short payback times. Numbers in $/mcf and $/MTpa can be stress-tested in the data-file.
-
India: electricity demand and power grid over time?
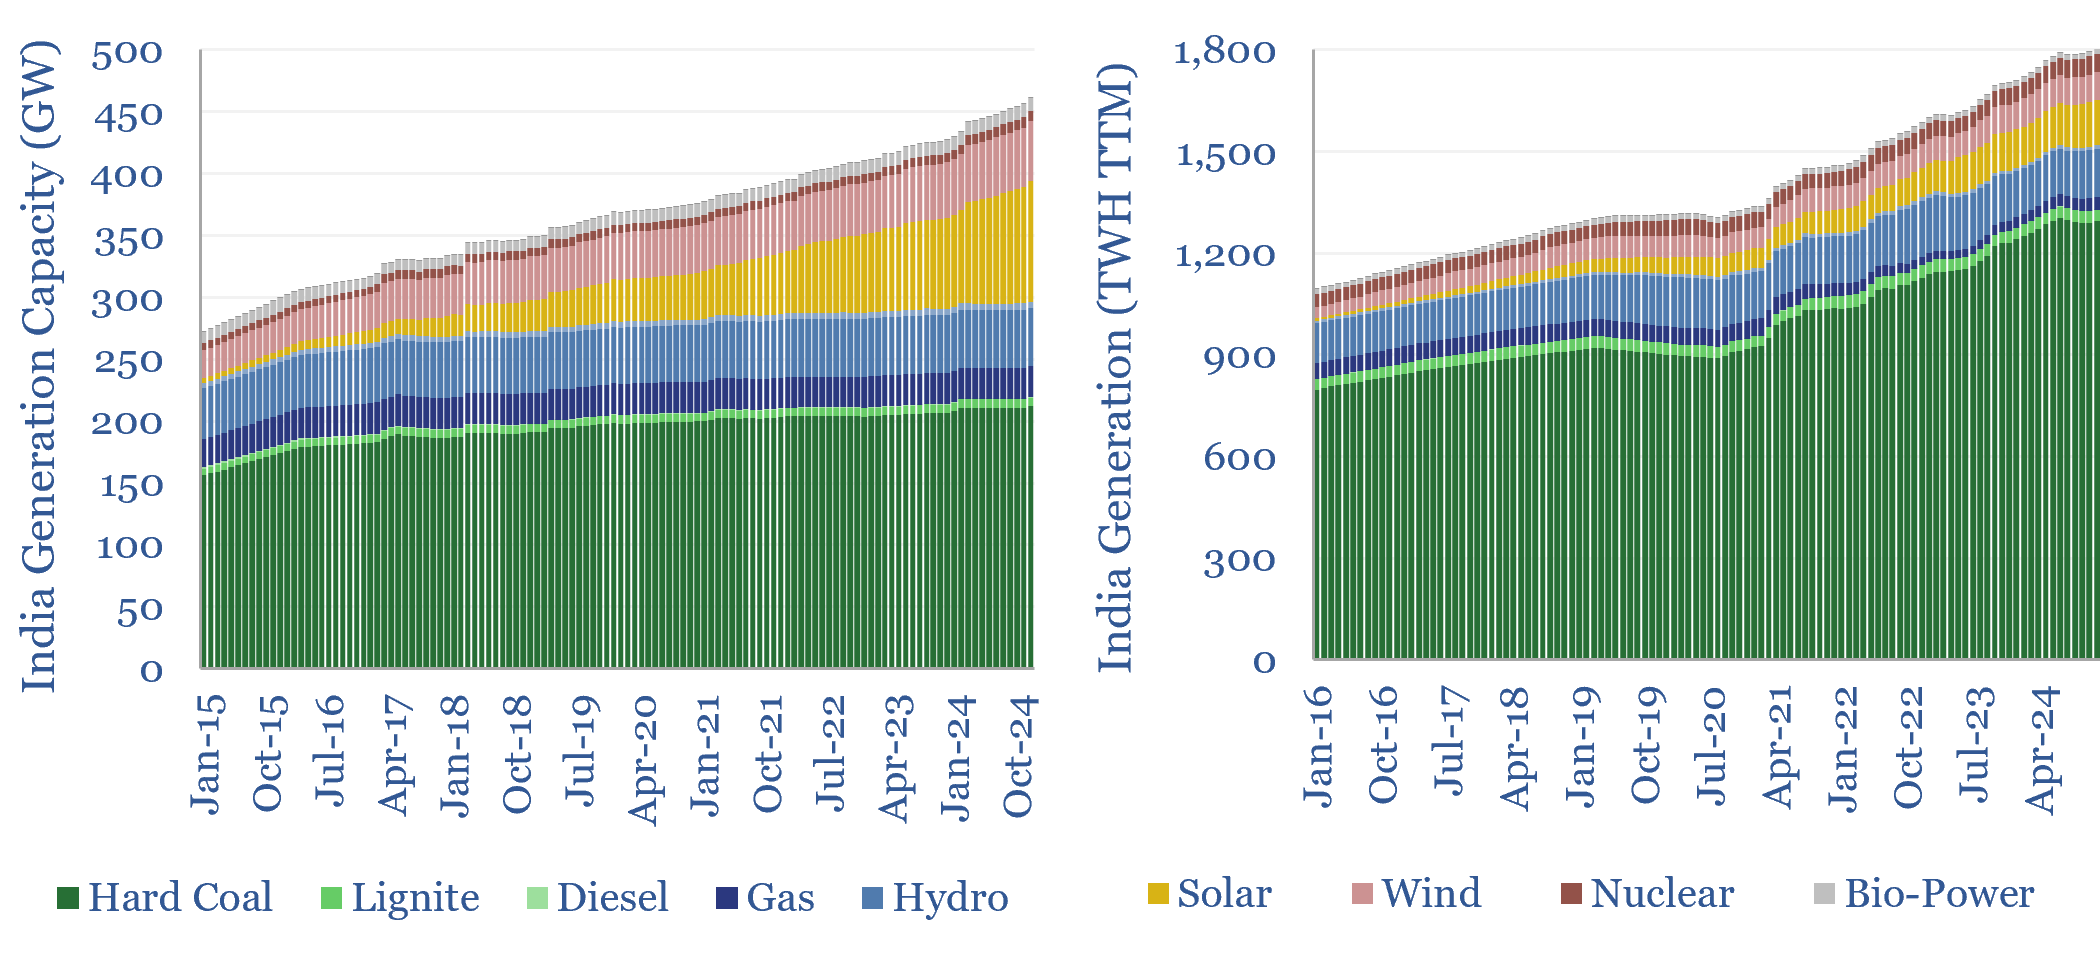
India’s electricity demand is growing by 6-8% (+100-140 TWH) per year, but 75% of the total still comes from coal, which has itself grown at a 5% CAGR over the past half-decade. Wind and solar would need to grow 4x faster than 2023 levels for thermal generation just to flatline. What implications and opportunities for…
-
Global energy demand by end use?
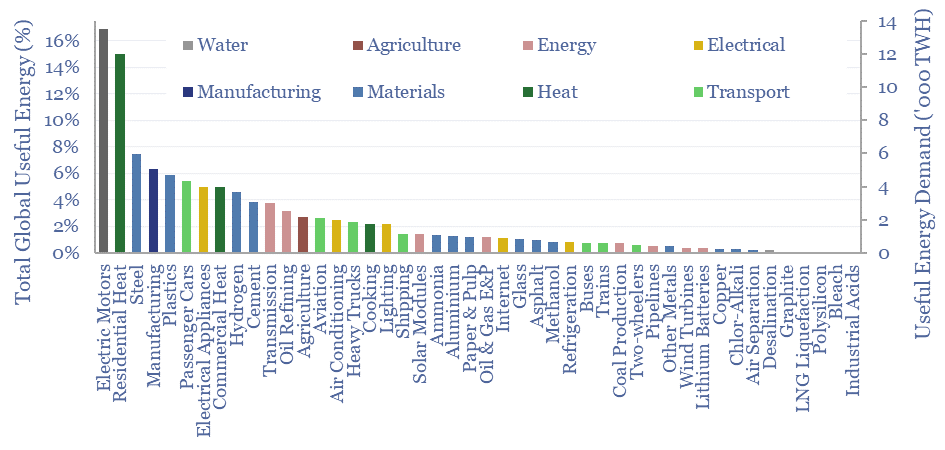
This data-file is a breakdown of global energy demand by end use, drawing across our entire research library, to disaggregate the global energy system across almost 50 applications, across transportation, heat, electricity, materials and manufacturing. Numbers, calculations, efficiencies and heating temperatures are in the data-file.
-
Grid connection sizes: residential, commercial and industrial?
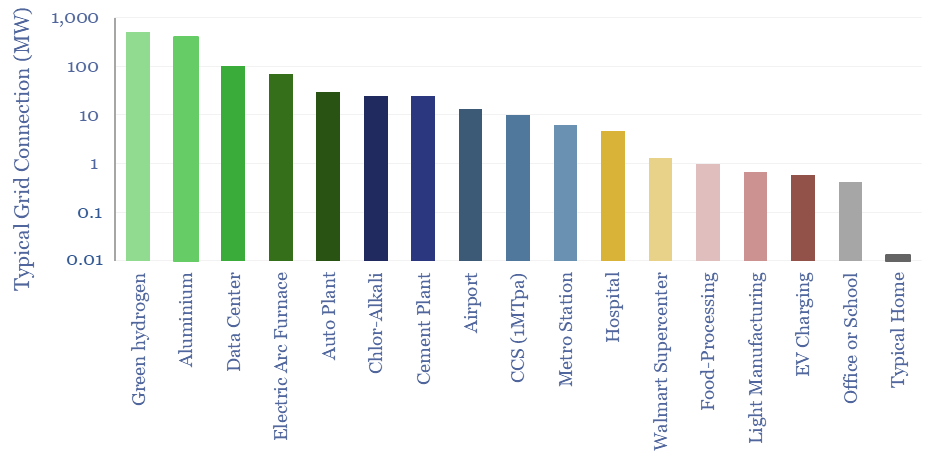
What are the typical sizes of grid connections at different residential, commercial and industrial facilities? This data-file derives aggregates estimates, from the 10kW grid connections of smaller homes to the GW-scale grid connections of large data-centers, proposed green hydrogen projects and aluminium plants.
-
Commodity price volatility: energy, metals and ags?
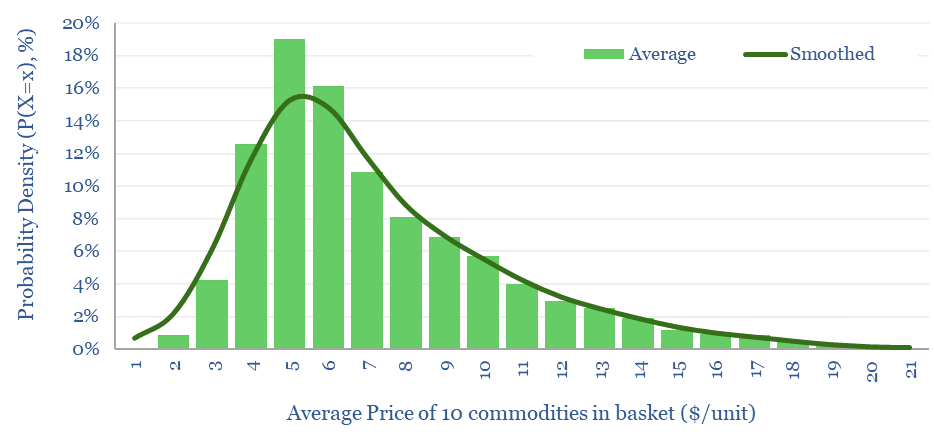
Commodity price volatility tends to be lognormally distributed, based on the data from ten commodities, over the past 50-years. Means are 20% higher than medians. Skew factors average +1.5x. Standard errors average 50%, while more volatile prices have more upside skew.
-
Carbon markets: by category over time?
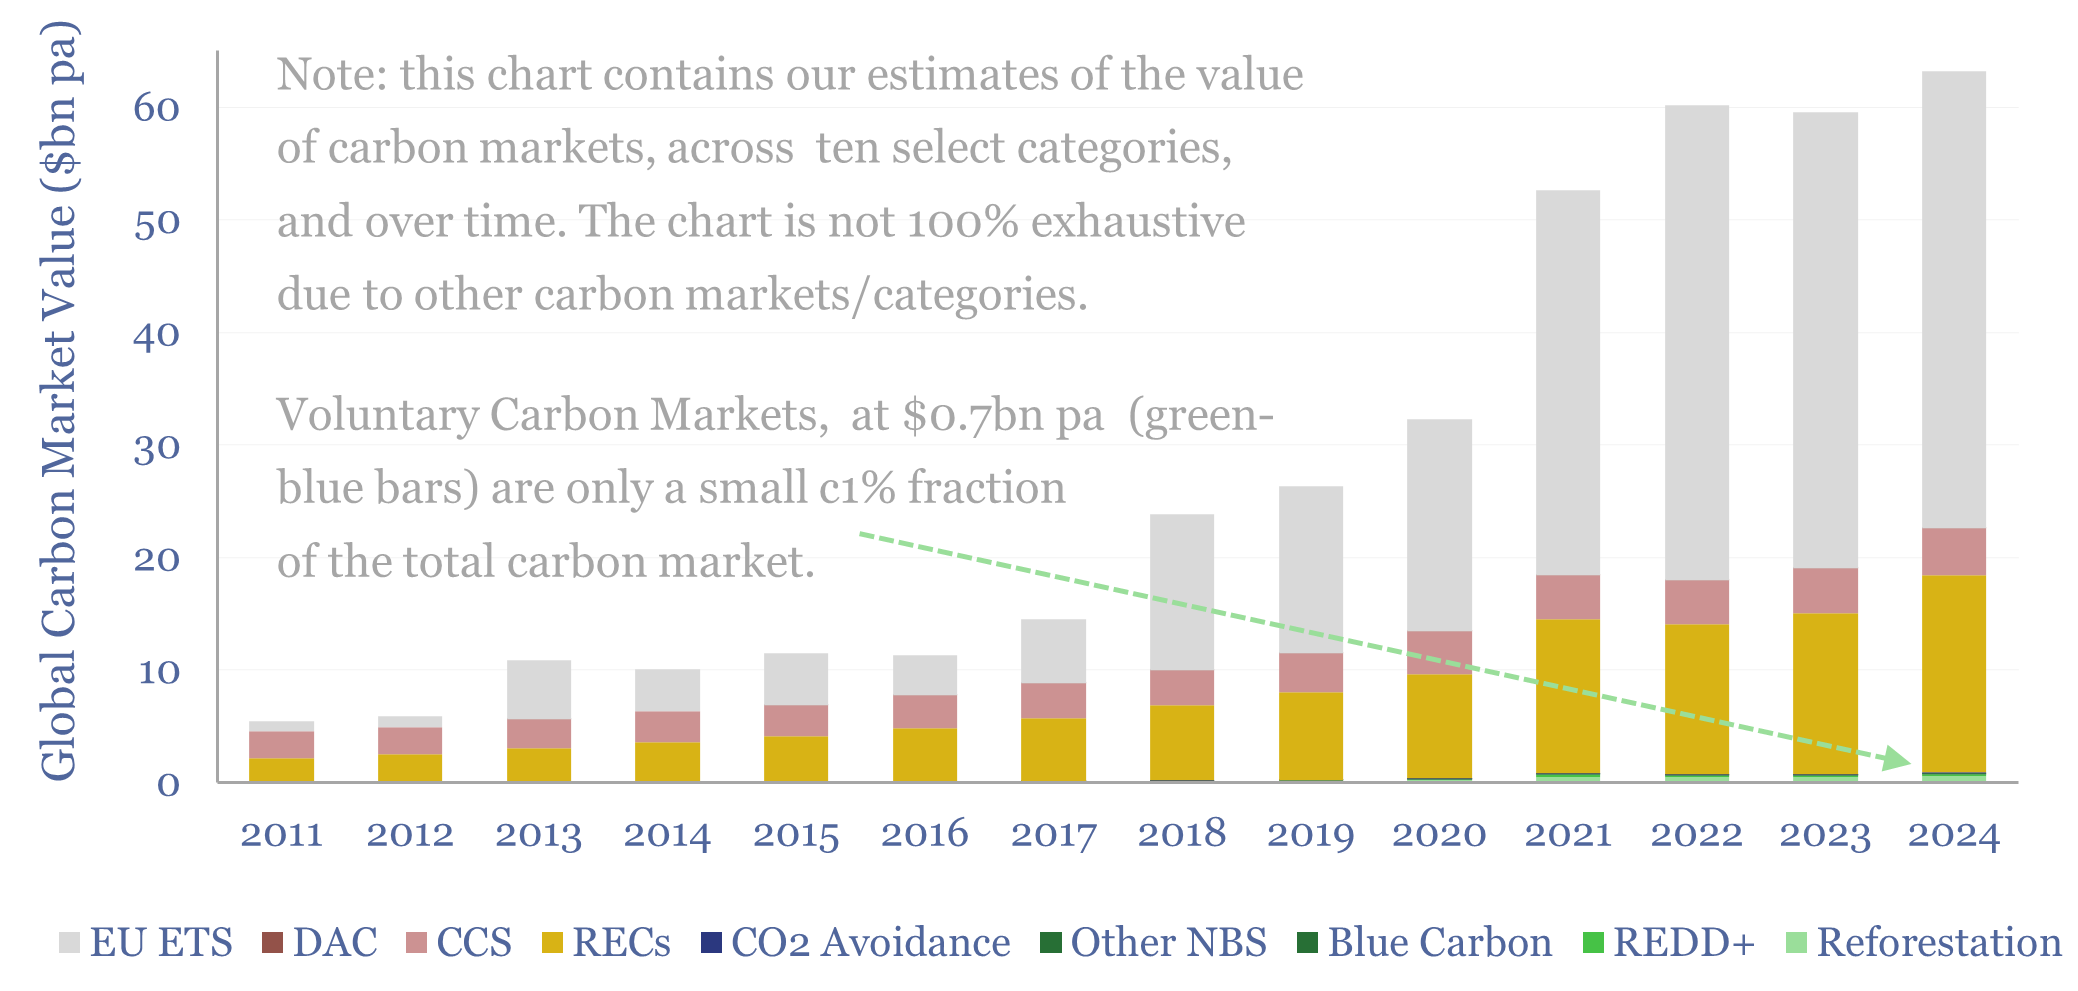
This data-file quantifies global carbon markets by category over time, including the EU ETS as an example of a compliance market, RECs, CCS and VERRA-certified “carbon credits”, across categories such as REDD, reforestation and other “carbon offsets”. We also draw analogies with charitable giving and forecast carbon markets out to 2050.
Content by Category
- Batteries (89)
- Biofuels (44)
- Carbon Intensity (49)
- CCS (63)
- CO2 Removals (9)
- Coal (38)
- Company Diligence (94)
- Data Models (838)
- Decarbonization (160)
- Demand (110)
- Digital (59)
- Downstream (44)
- Economic Model (204)
- Energy Efficiency (75)
- Hydrogen (63)
- Industry Data (279)
- LNG (48)
- Materials (82)
- Metals (80)
- Midstream (43)
- Natural Gas (148)
- Nature (76)
- Nuclear (23)
- Oil (164)
- Patents (38)
- Plastics (44)
- Power Grids (130)
- Renewables (149)
- Screen (117)
- Semiconductors (32)
- Shale (51)
- Solar (68)
- Supply-Demand (45)
- Vehicles (90)
- Wind (44)
- Written Research (354)