Search results for: “hydro”
-
Global electricity: by source, by use, by region?
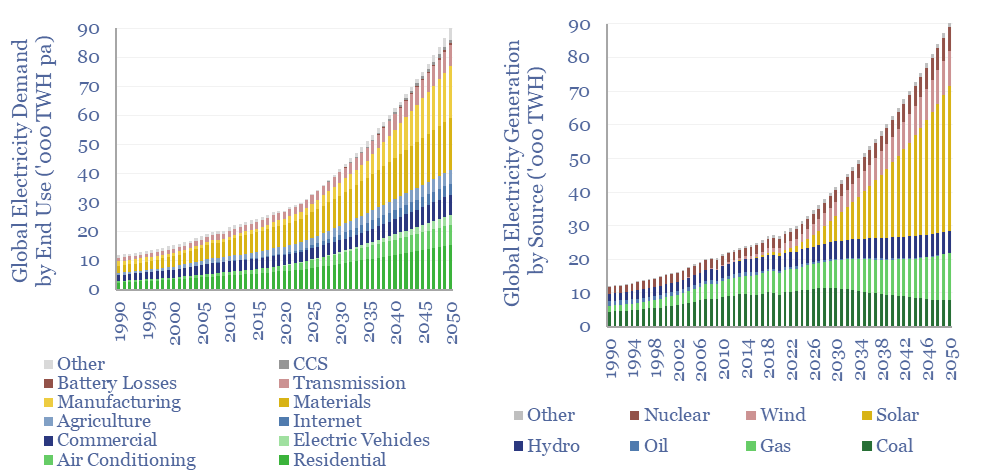
Global electricity supply-demand is disaggregated in this data-file, by source, by use, by region, from 1990 to 2050, triangulating across all of our other models in the energy transition, and culminating in over 50 fascinating charts, which can be viewed in this data-file. Global electricity demand rises 3x by 2050 in our outlook.
-
Energy return on energy invested?
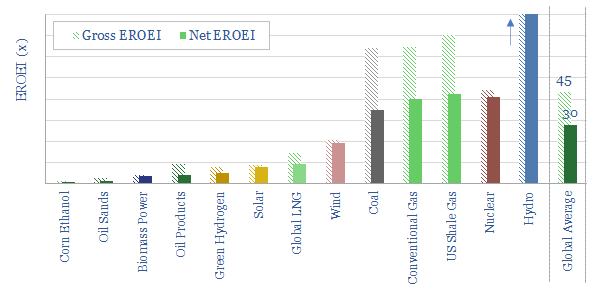
Global average EROEI is around 30x. Sources with EROEI above average are hydro, nuclear, natural gas and coal. Sources with middling EROEIs of 10-20x are solar, wind and LNG. Sources with weaker EROEIs are oil products, green hydrogen and some biofuels.
-
Eni Slurry Technology. A leader for IMO 2020?
This data-file models the economics of Eni’s Slurry Technology, for hydro-converting heavy crudes and fuel oils into light products. It is among the top technologies we have reviewed for the arrival of IMO 2020 sulfur regulation, achieving >97% conversion of heavy fractions.
-
Solar power: the economics?
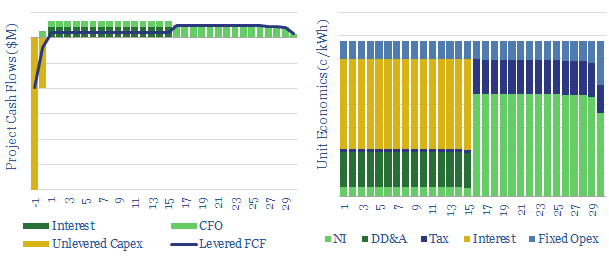
Levelized costs of solar electricity are estimated at 7c/kWh in our base case, but can realistically range from 4-40c/kWh. This data-file is a breakdown of solar costs, as a function of capex, opex, insolation, curtailment and decline rates. Solar can be highly competitive, up to 35-50% of many power grids.
-
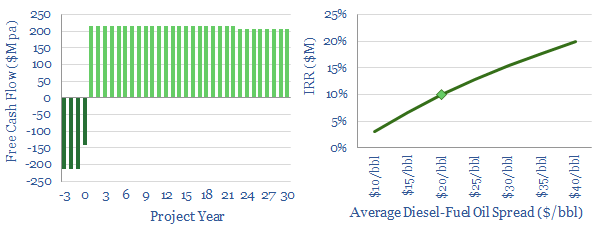
Renewable diesel: the economics?
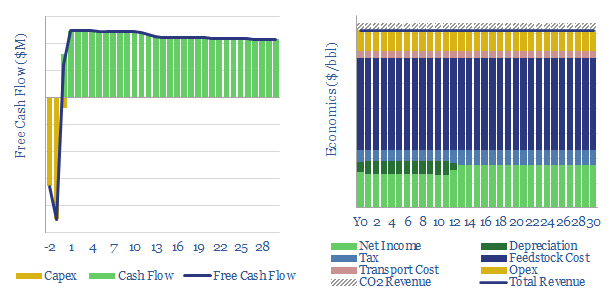
Our base case is that a US renewable diesel facility must achieve $4.6/gallon sales revenues (which is c$200/bbl) as it commercializes a product with up to 75% lower embedded emissions than conventional diesel. Similarly, a bio-diesel facility must achieve $3.6/gallon sales on a product with 60% lower embedded emissions.
-
US decarbonization: energy and CO2 emissions?
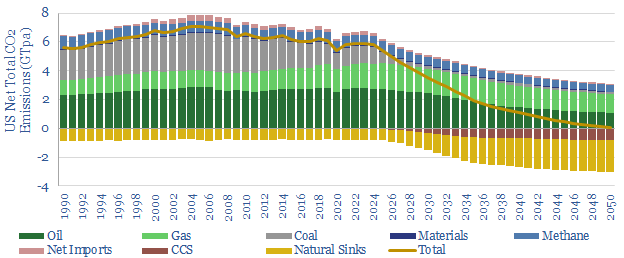
The US consumes 25,000 TWH of primary energy per year, which equates to 13,000 TWH of useful energy, and emits 6GTpa of CO2. This model captures our best estimates for what a pragmatic and economical decarbonization of the US will look like, reaching net zero in 2050, with forecasts for wind, solar, nuclear, hydro, oil,…
-
China Energy Demand and CO2 Emissions, 2000-2060
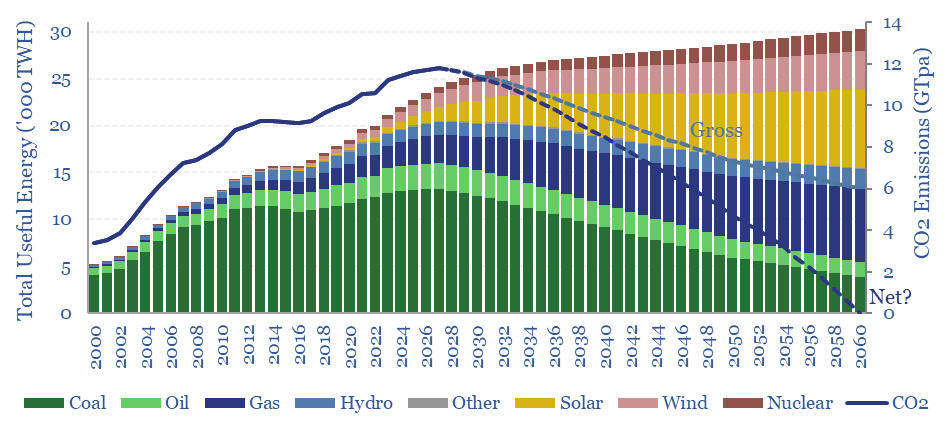
This data-file is our China Energy Model and China CO2 Model, disaggregating China’s energy demand by industry, across coal, oil, gas, wind, solar, hydro and nuclear, across c200 lines, from 2000-2060, with 20-input variables that can be stress-tested. There are routes to reach Net Zero in China by 2060, but it requires some heroic assumptions.
-
Power-to-liquids: companies commercializing electro-fuels?
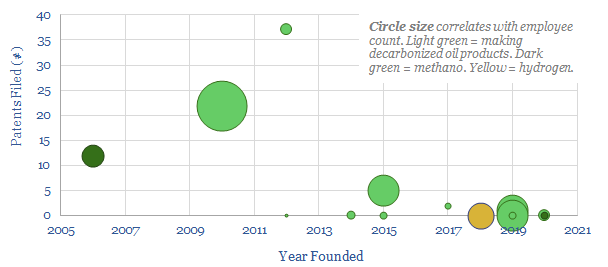
This data-file summarizes the details of c15 companies aiming to commercialise low-carbon electro-fuels, using power-to-liquids technologies, and their progress to-date. The average company was founded in 2015, with 5 patents and 15 employees. Although this is skewed towards 3-4 leaders.
-
Power plants: average capacity?
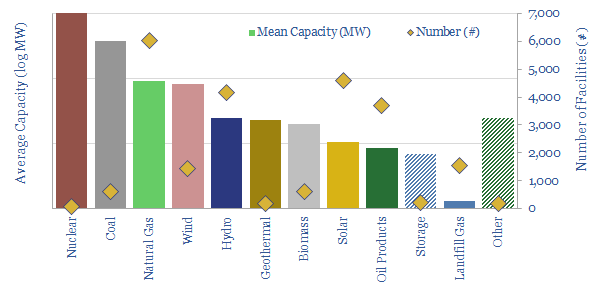
This data-file aggregates granular data into the average capacity of different types of power plants: wind, solar, nuclear, gas, hydro, coal, biomass, landfill gas and geothermal. Energy transition is going to increase the number of inter-connections to the grid by 10-100x.
-
Power plants: cold starts and ramp rates?
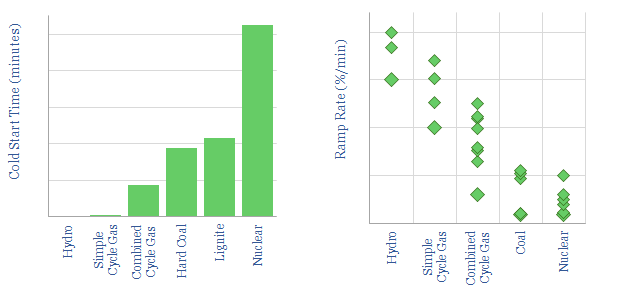
This data-file aggregates the ramp-up rates of power generation sources, as they start up from “cold”, and then as they ramp up (in MW per minute). Hydro and simple cycle gas turbines are fastest, followed by CCGTS, coal and nuclear.
Content by Category
- Batteries (89)
- Biofuels (44)
- Carbon Intensity (49)
- CCS (63)
- CO2 Removals (9)
- Coal (38)
- Company Diligence (95)
- Data Models (840)
- Decarbonization (160)
- Demand (110)
- Digital (60)
- Downstream (44)
- Economic Model (205)
- Energy Efficiency (75)
- Hydrogen (63)
- Industry Data (279)
- LNG (48)
- Materials (82)
- Metals (80)
- Midstream (43)
- Natural Gas (149)
- Nature (76)
- Nuclear (23)
- Oil (164)
- Patents (38)
- Plastics (44)
- Power Grids (130)
- Renewables (149)
- Screen (117)
- Semiconductors (32)
- Shale (51)
- Solar (68)
- Supply-Demand (45)
- Vehicles (90)
- Wind (44)
- Written Research (354)