Search results for: “inflation”
-
European energy use: by industry, by fuel, by country?
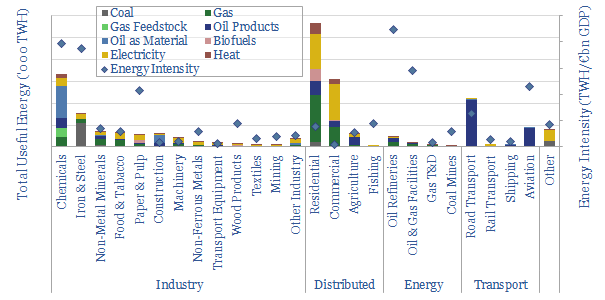
Europe comprises 7% of the world’s population, and 17% of its energy use. The purpose of this data-file is to disaggregate the energy use across 25 industries, six energy types and 28 countries. The data-file were updated in 2025, reflecting lagged Eurostat data from 2023.
-
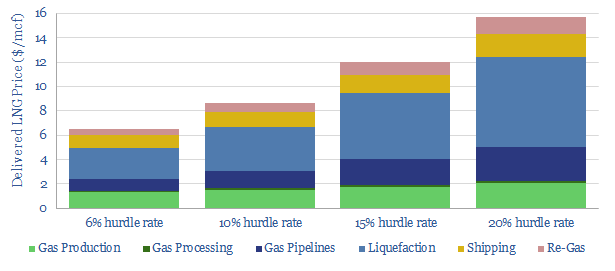
US LNG: new perceptions?
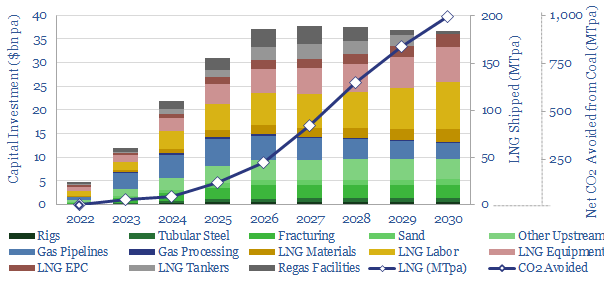
Perceptions in the energy transition are likely to change in 2022, amidst energy shortages, inflation and geopolitical discord. The biggest change will be a re-prioritization of US LNG. At $7.5/mcf, there is 200MTpa of upside by 2030, which could also abate 1GTpa of CO2. This 15 page note outlines our conclusions.
-
Energy crises: an overview from history?
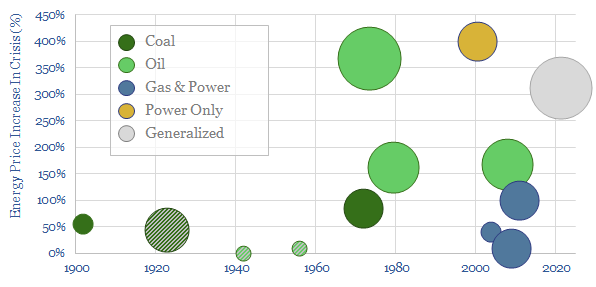
This data-file tabulates the history of energy crisis, by profiling a dozen energy crises that were caused by shortages of coal, oil, gas or electricity, since the start of the twentieth century. On average, prices have increased by 2.3x during an energy crisis, and been followed by rationing.
-
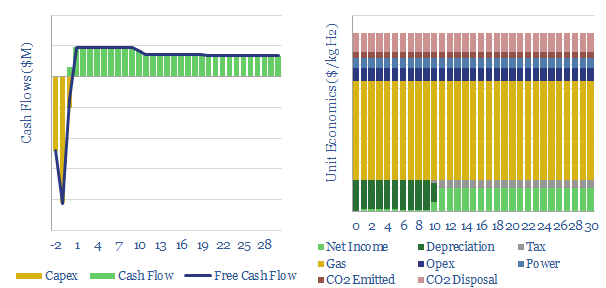
Green steel: circular reference?
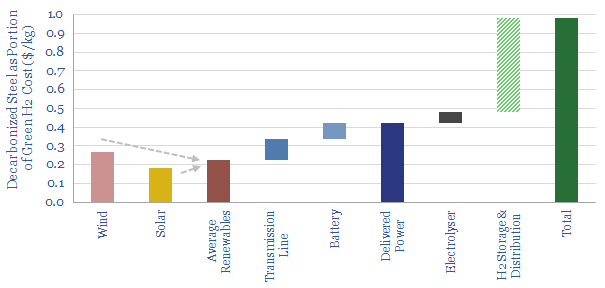
Steel explains almost c10% of global CO2. Hence 2021 has seen the world’s first ‘green steel’ made using green hydrogen. Yet inflation worries us. At $7.5/kg H2, green steel would cost 2x conventional steel. In turn, doubling the global steel price would re-inflate green H2 costs by $0.5/kg. This note explores inflationary feedback loops and…
-
End game: options to cure energy shortages?
This note considers five options to cure emerging gas and power shortages. Unfortunately, the options are mostly absurd. They point to inflation, industrial leakage and slipping global climate goals. But also opportunities in LNG, nuclear and efficiency technologies.
-
Solar costs: four horsemen?
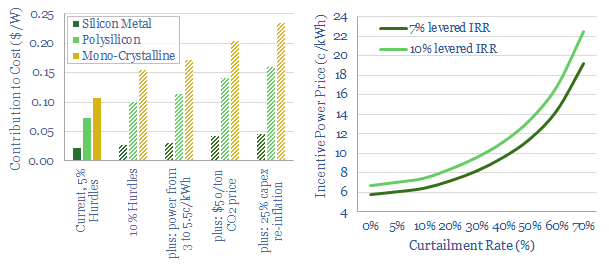
Solar costs have deflated by an incredible 90% in the past decade to 4-7c/kWh. Some commentators now hope for 2c/kWh by 2050. Further innovations are doubtless. But there are four challenges, which could stifle future deflation or even re-inflate solar. Most debilitating would be a re-doubling of CO2-intensive PV-silicon?
-
Land prices: an overview for renewables and reforestation?
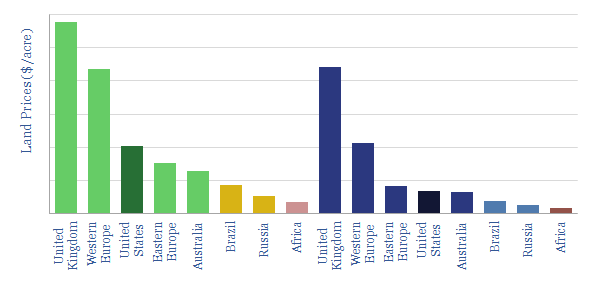
The purpose of this data-file is to estimate the cost of land, which matters for renewables and reforestation projects, but also amidst rising inflation. Prices can be opaque and variable. For example, arable land in Europe ranges 100x from $700 to $70,000 per acre. Nevertheless, the data-file shows vast quantities of low cost land available…
-
Onshore wind: the economics?
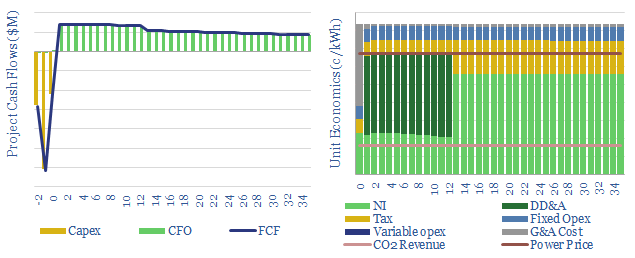
The levelized cost of onshore wind is estimated in this economic model, at 5-7c/kWh to generate 5-10% levered IRRs on new wind projects costing $1,000-3,000/kW. The model also contains a granular breakdown of wind capex costs, operating costs, and other economic assumptions for wind projects.
-
Methane reforming: costs of grey hydrogen, costs of blue hydrogen?
This data-file captures the economics of blue hydrogen production via reforming natural gas: either steam-methane reforming or auto-thermal reforming. Costs and operating parameters are compiled from technical papers. Blue hydrogen can be cost-competitive with CCS, while overall costs are most sensitive to gas prices.
-
Very long term historical commodity prices and disruptions?
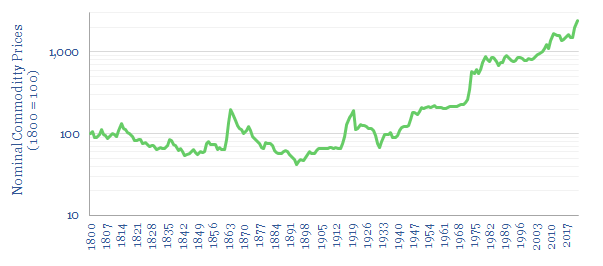
This data-file aggregates long-term historical commodity prices back to 1800, predominantly in the US, using academic records and census data. Historical commodity prices generally fell 30-70% in the 19th and early 20th century, punctuated by supply disruptions due to wars, then rose by 12.5x from 1945 to the present day.
Content by Category
- Batteries (89)
- Biofuels (44)
- Carbon Intensity (49)
- CCS (63)
- CO2 Removals (9)
- Coal (38)
- Company Diligence (94)
- Data Models (838)
- Decarbonization (160)
- Demand (110)
- Digital (59)
- Downstream (44)
- Economic Model (204)
- Energy Efficiency (75)
- Hydrogen (63)
- Industry Data (279)
- LNG (48)
- Materials (82)
- Metals (80)
- Midstream (43)
- Natural Gas (148)
- Nature (76)
- Nuclear (23)
- Oil (164)
- Patents (38)
- Plastics (44)
- Power Grids (130)
- Renewables (149)
- Screen (117)
- Semiconductors (32)
- Shale (51)
- Solar (68)
- Supply-Demand (45)
- Vehicles (90)
- Wind (44)
- Written Research (354)