Search results for: “climate model”
-
Combined heat and power: the economics?
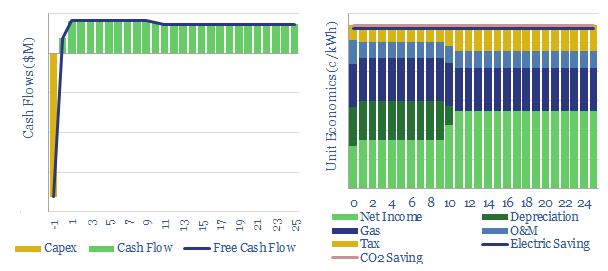
This data-file models the energy economics of a combined heat and power installation, to provide electricity and heating behind the meter, in lieu of purchasing electricity from the grid. Economics are strong, especially for larger units. CO2 emissions can also be reduced by 5-30% due to high efficiency.
-
Costs of CCS with the amine process?
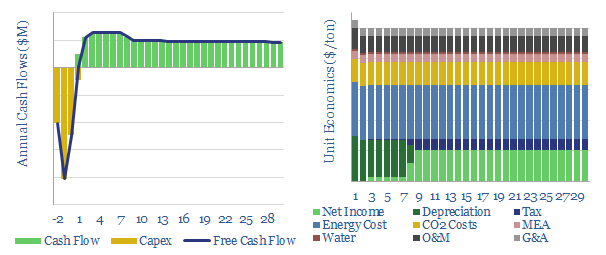
This data-file models the economics of capturing CO2 from exhaust flues using the amine process. Our base case estimate is informed by five tabs of cost data and technical papers, but all of the input assumptions can be flexed to stress-test costs. Total costs rise exponentially if it is necessary to capture CO2 from more…
-
HVDC power transmission: the economics?
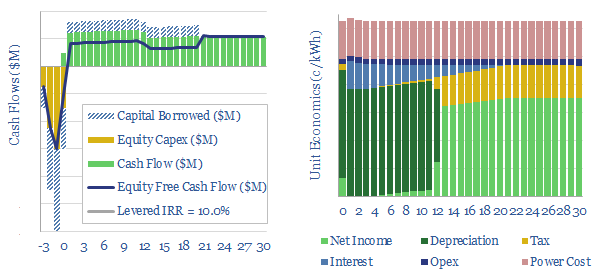
This model captures the economics of transporting electricity (e.g., wind and solar), over vast distances, using high voltage direct current power cables (HVDCs). Our base case shows a 3-10c/kWh transportation spread is required to earn a 10% levered IRR on 1,000-mile cable.
-
Ground source heat pumps: the economics?
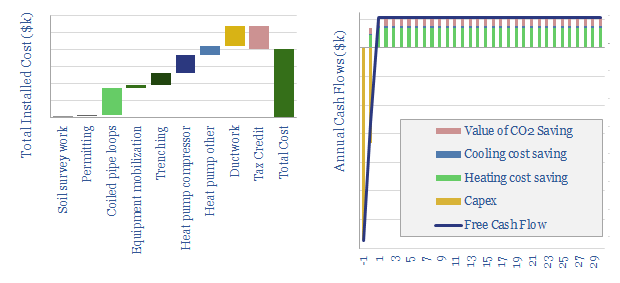
A ground source heat pump approximately doubles the efficiency of home heating and cooling, through heat-exchange with the shallow earth, which remains at 10-15°C temperatures year-round. This data-file captures the cost and CO2 savings.
-
US shale sand mines: simple economics?
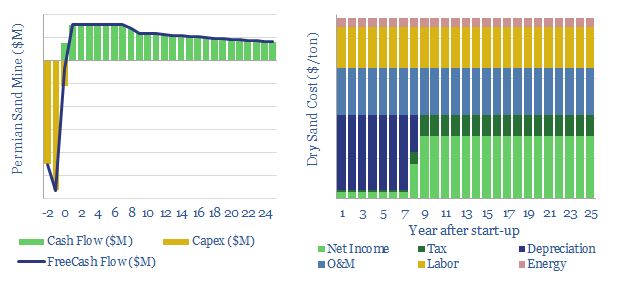
This model is a very simple breakdown of economics for in-basin sand production, around the US shale industry. The model can also be used to quantify the potential savings from shifting from dry sand to wet sand, estimated at c25% of total costs.
-
Electric vehicle charging: the economics?
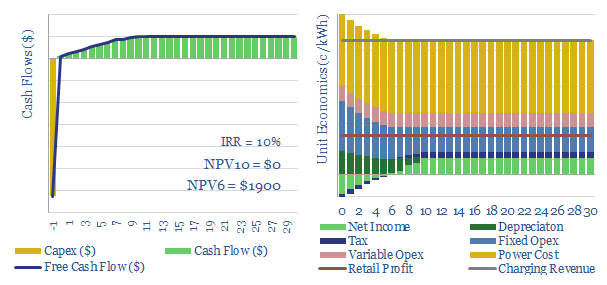
This data-file models the economics of electric vehicle chargers, by disaggregating the costs of different charger types. Economics are most favorable where they lead to incremental retail purchases and for faster chargers. Economics are least favorable around apartments, charging at work and for slower charging speeds.
-
Cross laminated timber: costs and economics?
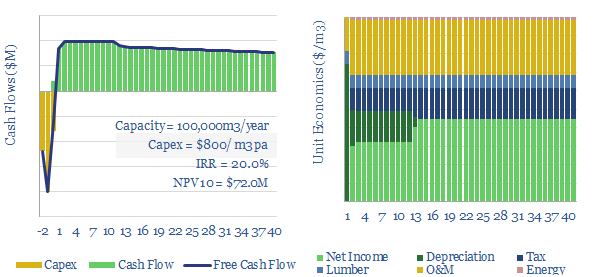
Cross laminated timber costs $1,200/ton, or $500/m3 pa, in order to derive 10-20% IRRs at a production facility costing $2,000/Tpa in capex. Cost lines include input costs of timber, polyurethane resins, labor, electricity, O&M, and capital costs. This data file is our economic model for mass timber production.
-
Vertical greenhouses: the economics?
This data-file models the economics of vertical greenhouses, for growing greens, fruits and vegetables close to the consumer, in large multi-story facilities, lit by LED lighting. Our base case yields 10% IRRs off $1.25k/m2 capex and 50kg/m2/year yields. CO2 intensity depends heavily upon the CO2 intensity of the underlying grid.
-
Wind and solar capacity additions?
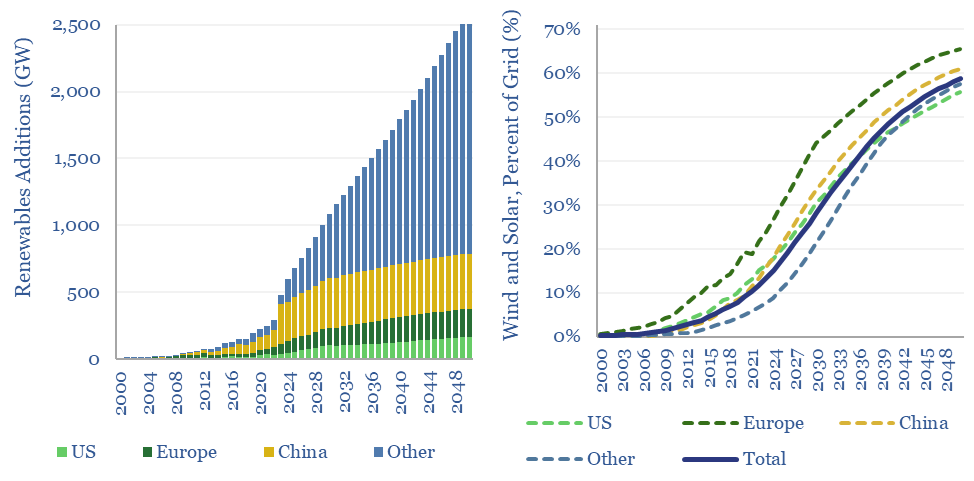
Global wind and solar capacity additions reached 600GW pa (AC-basis) in 2024, which is 2x higher than in 2021 and 10x higher than in 2011. The pace of gross wind and solar capacity additions can rise by a further 5x by 2050, bringing wind and solar to 60% of a greatly expanded global power grid…
-
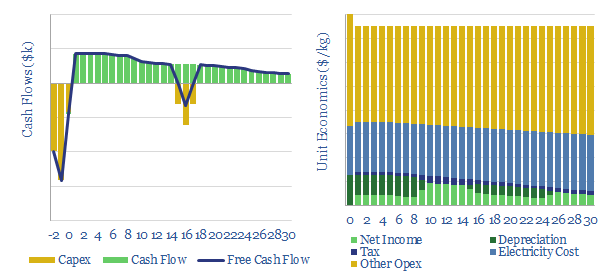
Uranium mining: the economics?
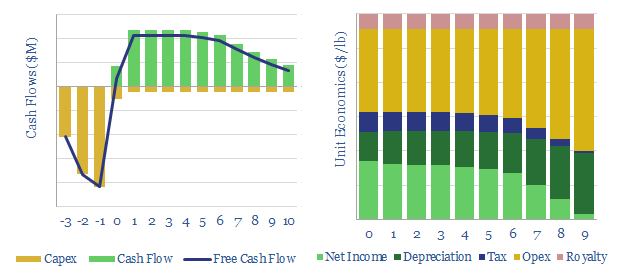
This data-file disaggregates the marginal costs of a new uranium mine, as a simple function of uranium prices, ore grade, capex and opex. Our base case is a marginal cost of $60/lb for a 10% IRR. Cash costs range from $7-40/lb. But lower ore grades can easily require $90/lb uranium to justify investment.
Content by Category
- Batteries (89)
- Biofuels (44)
- Carbon Intensity (49)
- CCS (63)
- CO2 Removals (9)
- Coal (38)
- Company Diligence (95)
- Data Models (840)
- Decarbonization (160)
- Demand (110)
- Digital (60)
- Downstream (44)
- Economic Model (205)
- Energy Efficiency (75)
- Hydrogen (63)
- Industry Data (279)
- LNG (48)
- Materials (82)
- Metals (80)
- Midstream (43)
- Natural Gas (149)
- Nature (76)
- Nuclear (23)
- Oil (164)
- Patents (38)
- Plastics (44)
- Power Grids (130)
- Renewables (149)
- Screen (117)
- Semiconductors (32)
- Shale (51)
- Solar (68)
- Supply-Demand (45)
- Vehicles (90)
- Wind (44)
- Written Research (355)