Search results for: “companies”
-
Renewables: share of global energy and electricity by country?
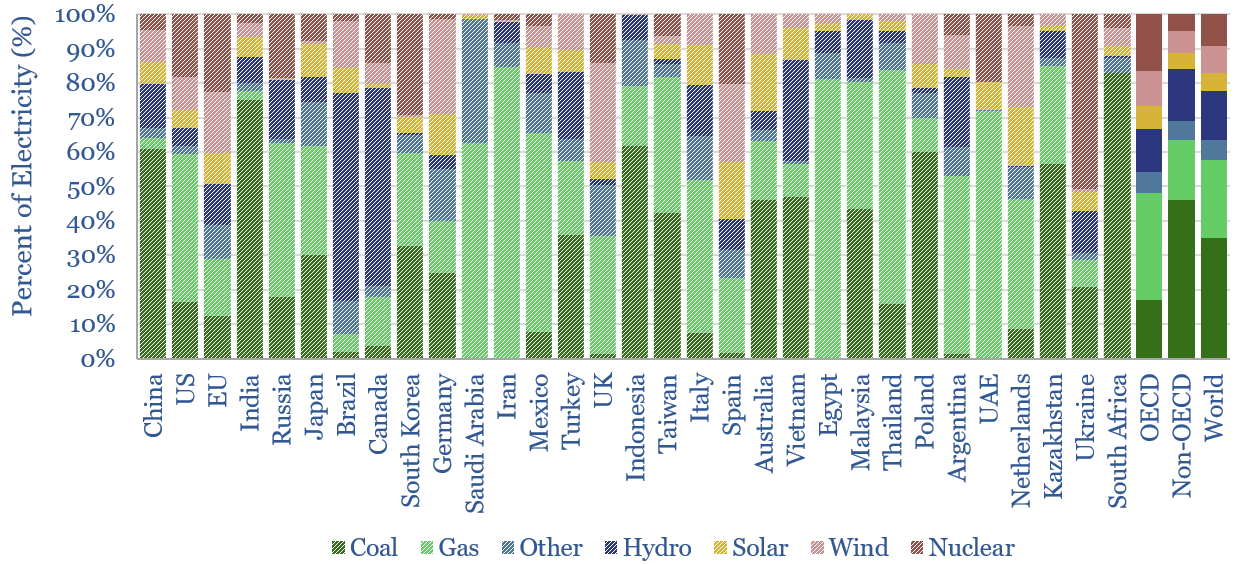
This data-file is an Excel “visualizer” for some of the key headline metrics in global energy: such as total global energy use, electricity generation by source and growing renewables penetration; broken down country-by-country, and showing how these metrics have changed over time.
-
Blockchain in the Oil & Gas Supply Chain
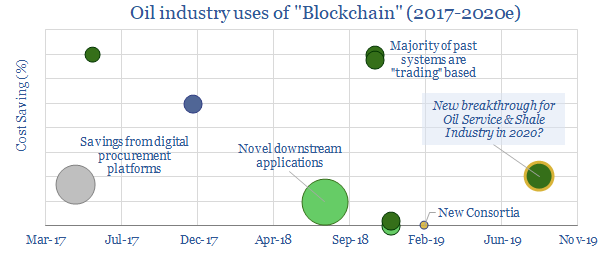
This datafile tabulates ten examples of deploying Blockchain in the oil and gas industry since 2017; including companies and cost savings. Most prior examples are in trading. For 2020, we are particularly excited by the broadening of Blockchain technologies into the procurement industry, which can deflate shale costs.
-
Battery Patents: Lithium Leaders and New Breakthroughs?
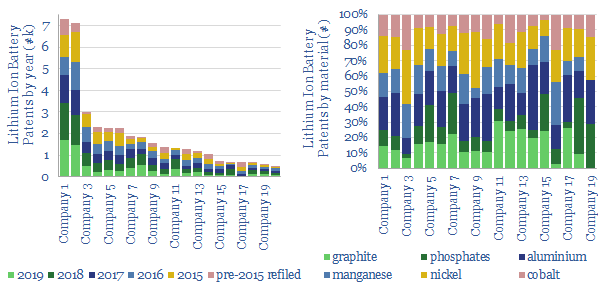
Continued deflation in lithium ion batteries is suggested by a new record of 26,000 patents filed in 2019, hence this data-file identifies the technology leaders. Elsewhere, redox flow batteries patents have doubled since 2014, while interest has been waning in solid state batteries (-57% since 2014) and liquid metal batteries (-67%).
-
Solar Energy: Where’s the IP?
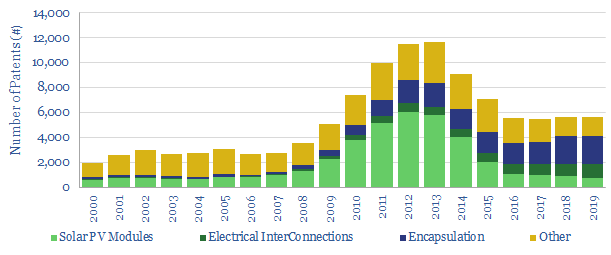
We have tabulated 110,000 solar patents. Research peaked in 2012-13, at 11,500 patents/year. It since slowed to c6,000/year. Yet Chinese companies have ramped up to 50% of all the filings, and now comprise 14 out of 2019’s top 25 solar patent filers. Majors’ patents comprise c0.5% of the total, with one SuperMajor clearly leading.
-
Hydraulic Fracturing: where’s the IP?
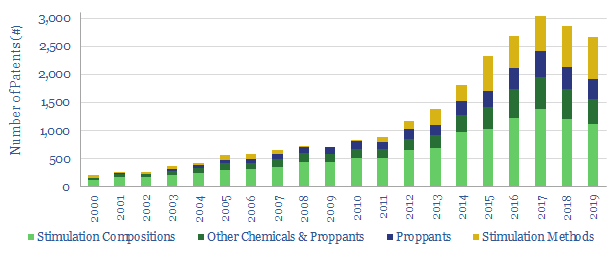
This data-file tracks 17,000 hydraulic fracturing patents filed by geography, by company, by year, since 2010. 2020 has slowed by 6% from peak, with a c36% US slowdown masked by a 33% Chinese expansion. Remarkably, in 2019, the leading Chinese Major filed more patents than the leading US Service provider. The full data-file ranks the companies.
-
CO2 intensity of coal production?
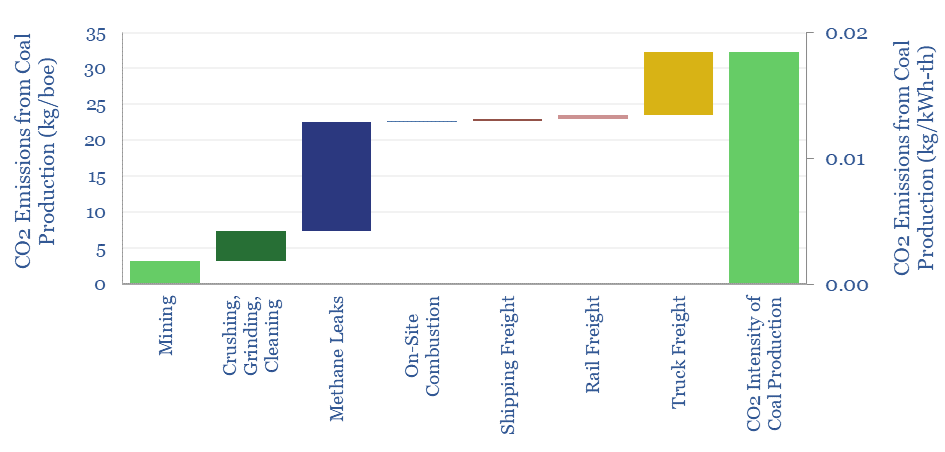
Producing a ton of coal typically emits 0.19T of CO2, equivalent to 50kg/boe. The numbers comprise mining, methane leaks and transportation. Hence domestic coal production will tend to emit 2x more CO2 than gas production, plus c2x more CO2 in combustion. However, numbers vary widely based on input assumptions, such as methane lakage rates, btu content…
-
Turn the Plastics into Roads?
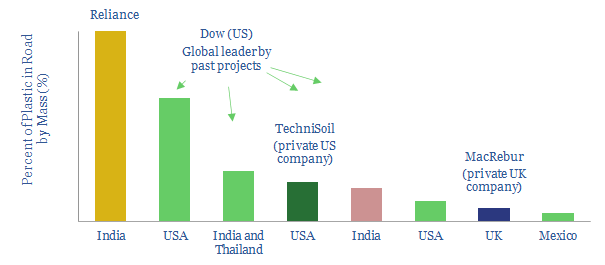
An opportunity is emerging to absorb mixed plastic waste, displacing bitumen from road asphalts. We find strong economics, with net margins of $200/ton of plastic, deflating the materials costs of roads by c4%. The challenge is scaling the opportunity beyond 20MTpa, as unrecycled waste plastics surpass 320MTpa. Leading companies include Dow (US, public) and MacRebur…
-
Biogas: the economics?
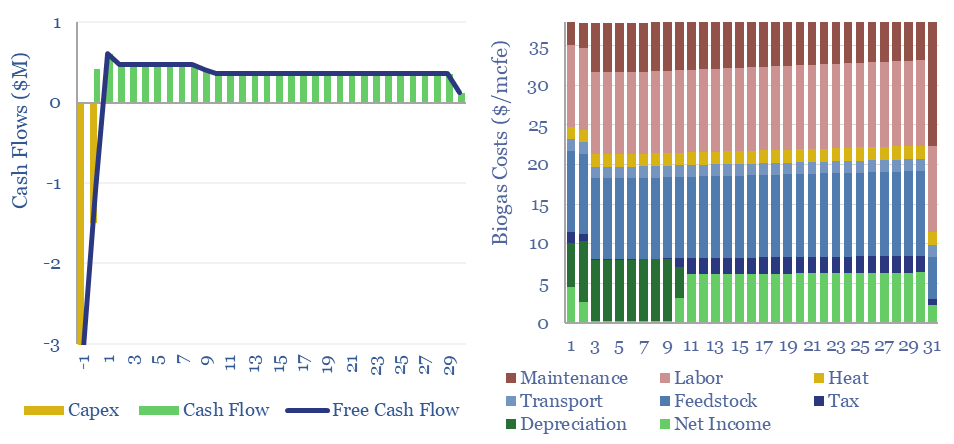
Biogas costs are broken down in this economic model, generating a 10% IRR off $180M/kboed capex, via a mixture of $16/mcfe gas sales, $60/ton waste disposal fees and $50/ton CO2 prices. High gas prices and landfill taxes can make biogas economical in select geographies. Although diseconomies of scale reward smaller projects?
-
US ethanol plants: what CO2 intensity?
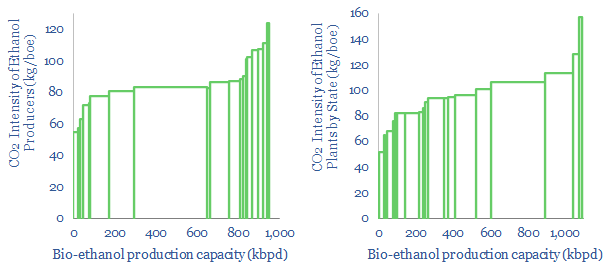
US bioethanol plants produce 1Mbpd of liquid fuels, with an average CO2 intensity of 85kg/boe. Overall, corn-based bioethanol has c40% lower CO2 than oil products. We screened the leaders and laggards by CO2-intensity, covering Poet, Valero, Great Plains, Koch, Marathon and White Energy.
-
Energy infrastructure: labor intensity?
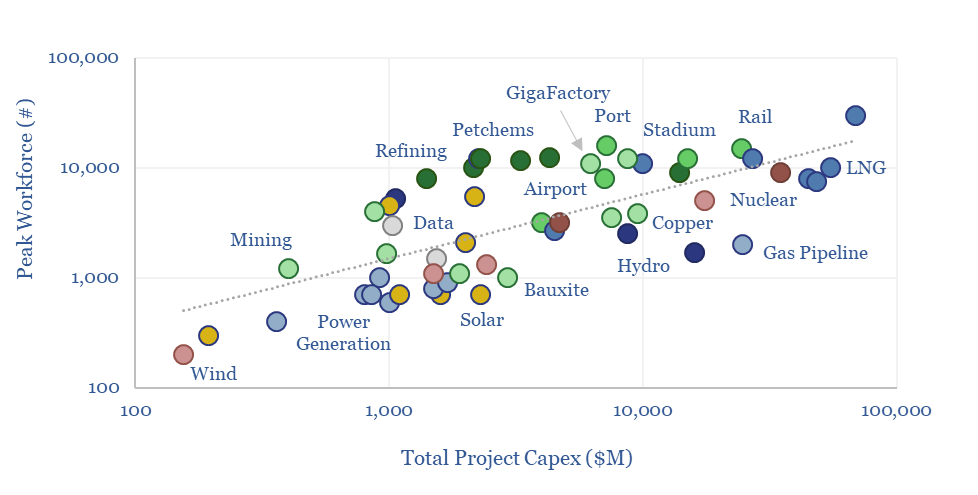
How many jobs are created by different types of energy? This data-file aggregates the labor intensity of different energy sources, which average 50-150 workers per TWH, on an ongoing basis. Another rough rule of thumb is that each $1bn of capex requires 1,000 peak constructon workers, although some project categories are materially more labor intensive…
Content by Category
- Batteries (84)
- Biofuels (42)
- Carbon Intensity (49)
- CCS (63)
- CO2 Removals (9)
- Coal (36)
- Company Diligence (85)
- Data Models (790)
- Decarbonization (156)
- Demand (103)
- Digital (50)
- Downstream (44)
- Economic Model (194)
- Energy Efficiency (75)
- Hydrogen (63)
- Industry Data (260)
- LNG (48)
- Materials (77)
- Metals (69)
- Midstream (43)
- Natural Gas (144)
- Nature (75)
- Nuclear (22)
- Oil (161)
- Patents (38)
- Plastics (43)
- Power Grids (116)
- Renewables (147)
- Screen (107)
- Semiconductors (30)
- Shale (50)
- Solar (67)
- Supply-Demand (45)
- Vehicles (88)
- Wind (40)
- Written Research (333)
Show More