Search results for: “direct air capture”
-
Global gas turbines by region and over time?
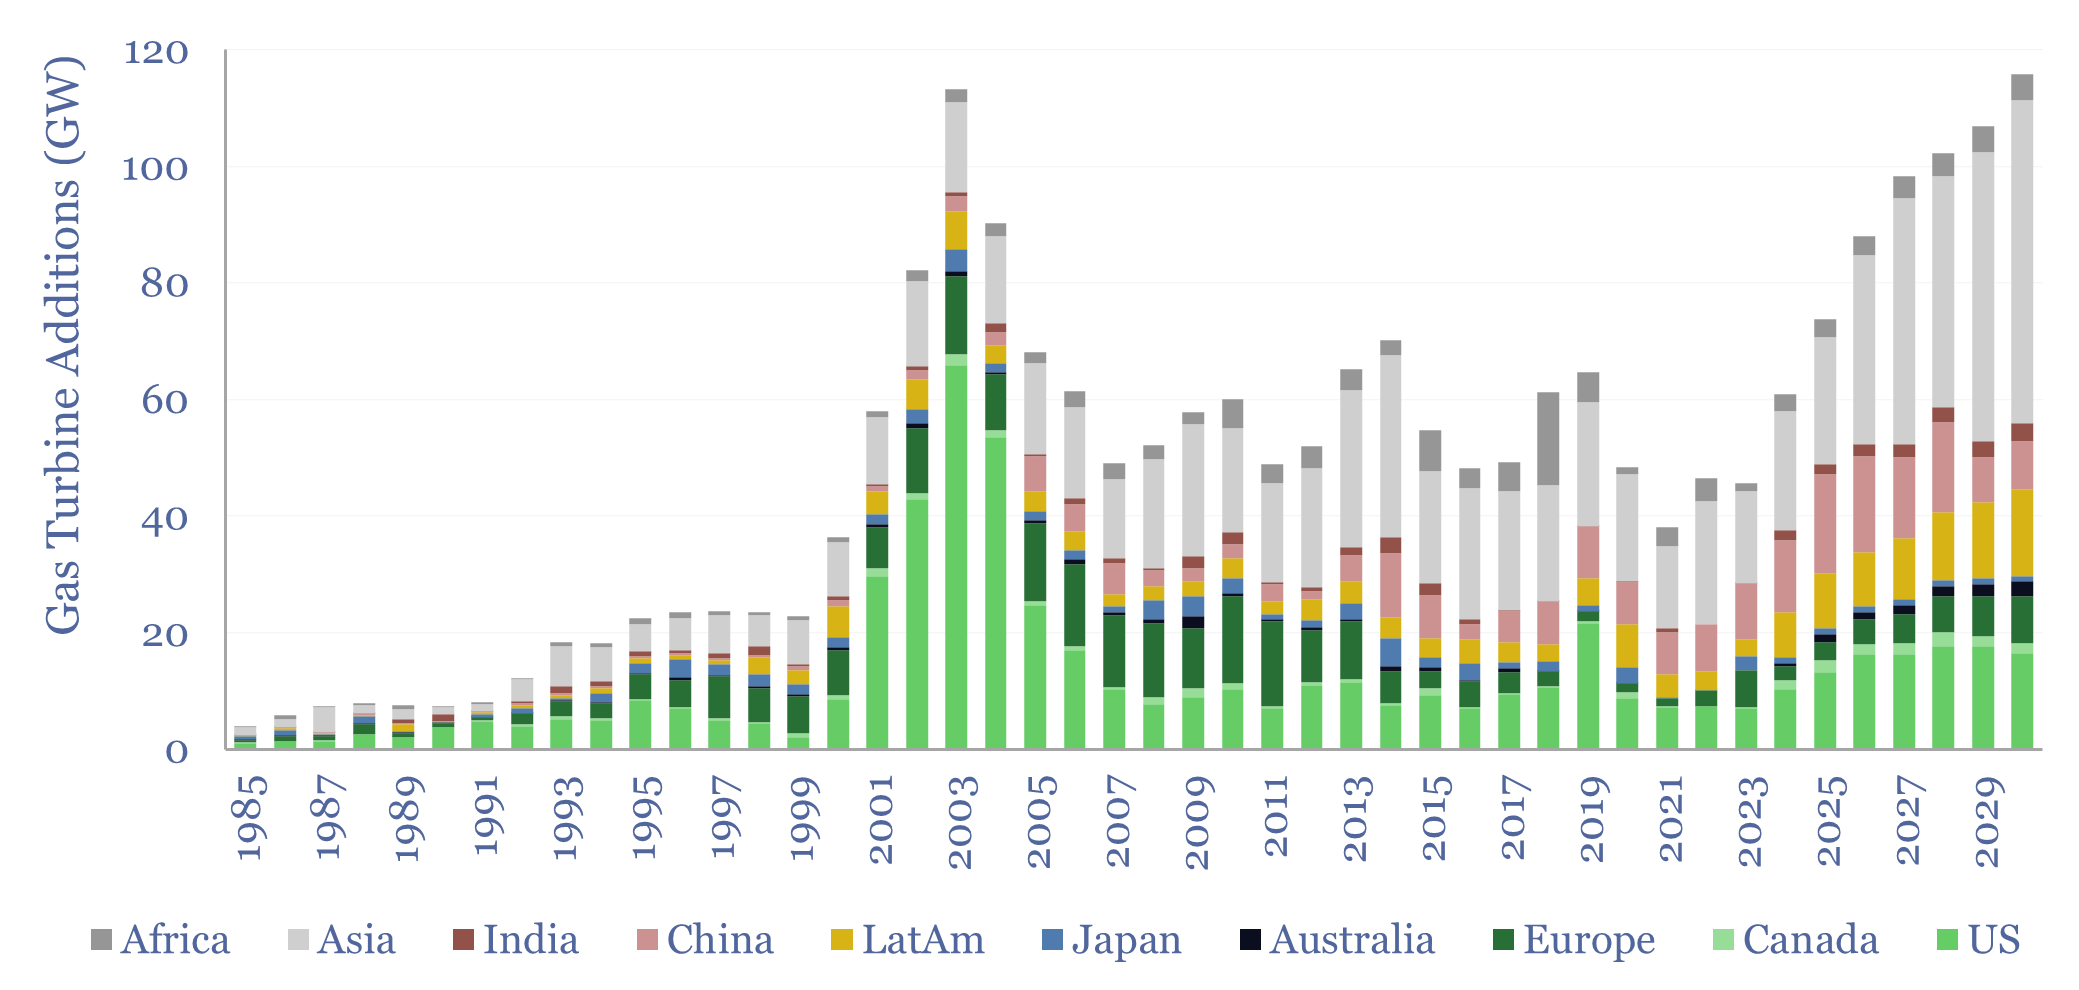
Global gas turbine additions averaged 50 GW pa over the decade from 2015-2024, of which the US was 20%, Europe was 10%, Asia was 50%, LatAm was 10% and Africa was 10%. Yet global gas turbine additions could double to 100 GW pa in 2025-30. This data-file estimates global gas turbine capacity by region and…
-
Average home sizes: living space per person?
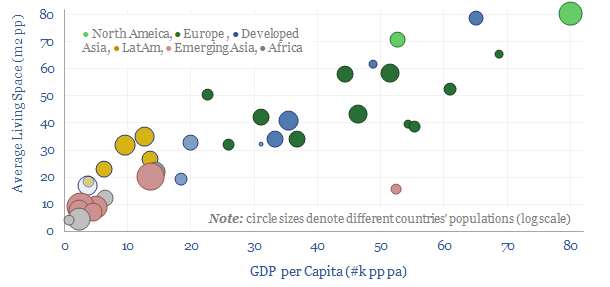
Average home sizes matter for overall residential energy demand, heating and cooling demand. Hence the purpose of this data-file is to aggregate average home sizes by country, then translate the data into living space per capita. A good rule of thumb is that each $1k pp pa of GDP translates one-for-one into 1m2 pp pa…
-
Silicon carbide: production costs?
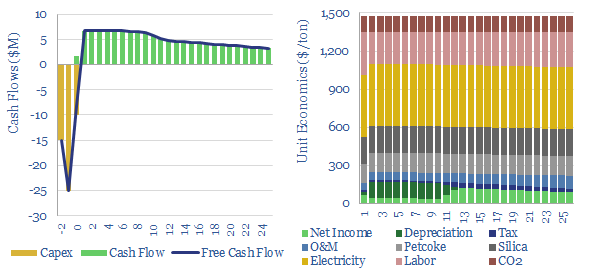
This data-file captures the costs of producing different grades of silicon carbide: from materials grade SiC ($1,500/ton marginal cost, 5 tons/ton CO2 intensity) through to SiC wafers that are used in the electronics industry ($30M/ton, 200 tons/ton?). SiC semiconductor remains opaque.
-
Energy needed to produce steam: enthalpy and entropy data?
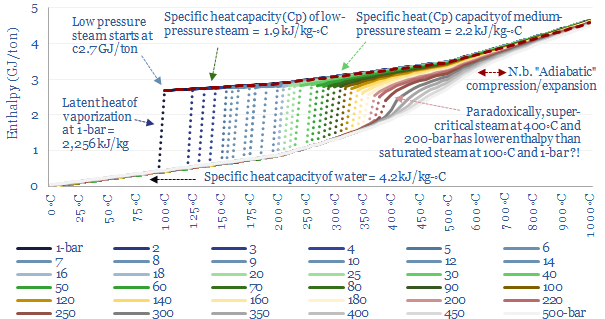
This data-file quantifies the energy needed to produce steam, for industrial heat, chemicals, CCS plants and hydrogen reforming? As rules of thumb, low pressure saturated steam at 100◦C requires 2.6 GJ/ton (720kWh/ton), medium pressure dry steam at 6-bar and 300◦C requires 3 GJ/ton (830kWh/ton) and super-critical steam at 250-bar and 600◦C requires 4 GJ/ton (1,150kWh/ton).
-
Lithium ion batteries: energy density?
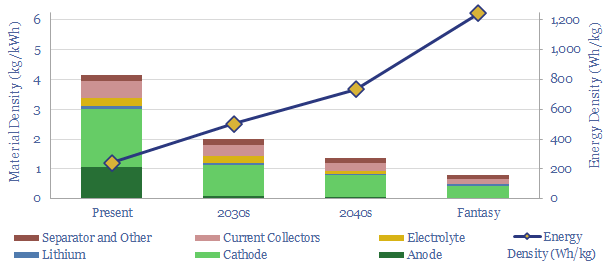
Today’s lithium ion batteries have an energy density of 200-300 Wh/kg. I.e., they contain 4kg of material per kWh of energy storage. Technology gains can see lithium ion batteries’ energy densities doubling to 500Wh/kg in the 2030s, trebling to 750 Wh/kg by the 2040s, and the best possible energy densities are around 1,250 Wh/kg. This…
-
EV incentives: vehicle taxes by country?
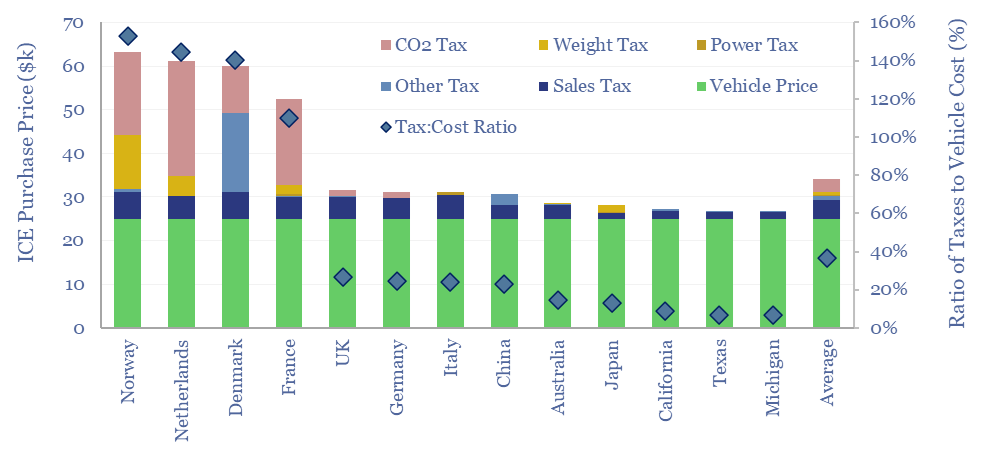
Vehicle taxes by country are tabulated in this data-file, based on vehicles’ pre-tax prices, tailpipe emissions, weight, engine size and power. They range from sub-10% of the cost of the underlying vehicle in the US, through to 150% in Norway, and above 100% in Netherlands, Denmark and France. What implications for EV adoption?
-
Duck curves: US power price duckiness over time?
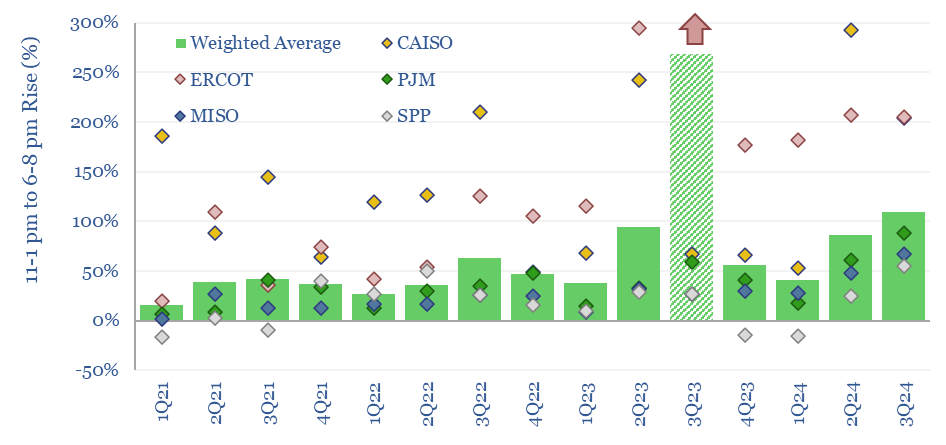
In solar-heavy grids, power prices trough around mid-day, then ramp up rapidly as the sunset. This price distribution over time is known as the duck curve. US power prices are getting 25-30% more ducky each year, based on some forms of measurement. Power prices are clearly linked to the instantaneous share of wind/solar in grids.
Content by Category
- Batteries (89)
- Biofuels (44)
- Carbon Intensity (49)
- CCS (63)
- CO2 Removals (9)
- Coal (38)
- Company Diligence (94)
- Data Models (838)
- Decarbonization (160)
- Demand (110)
- Digital (59)
- Downstream (44)
- Economic Model (204)
- Energy Efficiency (75)
- Hydrogen (63)
- Industry Data (279)
- LNG (48)
- Materials (82)
- Metals (80)
- Midstream (43)
- Natural Gas (148)
- Nature (76)
- Nuclear (23)
- Oil (164)
- Patents (38)
- Plastics (44)
- Power Grids (130)
- Renewables (149)
- Screen (117)
- Semiconductors (32)
- Shale (51)
- Solar (68)
- Supply-Demand (45)
- Vehicles (90)
- Wind (44)
- Written Research (354)
