Search results for: “gas”
-
Platform supply vessels: what contribution to CO2?
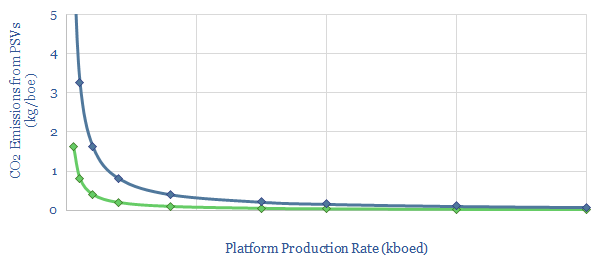
This data-file calculates the contribution of Platform Supply Vessels (PSVs) to an oil and gas asset’s emissions. Our base case estimate is 0.1kg/boe for a productive asset in a well-developed basin. Numbers rise 4x in a remote basin, and by another c4x for smaller fields. 1kg/boe is possible. These emissions can be lowered by 10-20% through…
-
Oil markets: the aftermath?
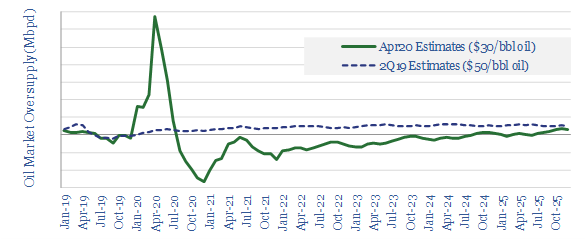
Oil and gas pricing could rebound sharply to the upside after the COVID crisis. Where we have long feared 2-3Mbpd of structural over-supply, continuing out to 2025, our new models suggest an 85% chance of under-supplied markets from mid-2021 onwards, following the loss of 4.5Mbpd of shale growth and c3Mbpd of greenfield growth. This 4-page…
-
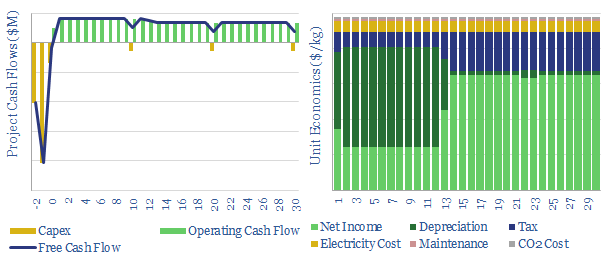
Green hydrogen: the economics?
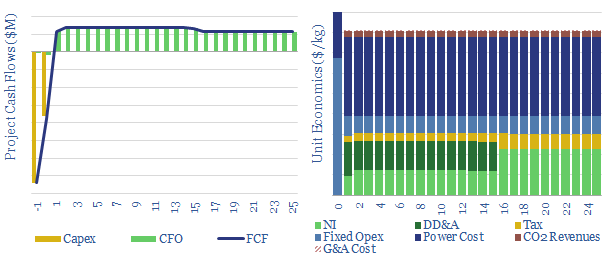
We have modelled the economics of a green hydrogen project, electrolysing water using renewable energy. An H2 price of $8/kg ($60/mcfe) is required to earn a 10% return. Costs data are captured. The most challenging input variable is not capex cost or efficiency, but utilization rate, if the project is to be truly green.
-
Coal-to-Power Project Economics
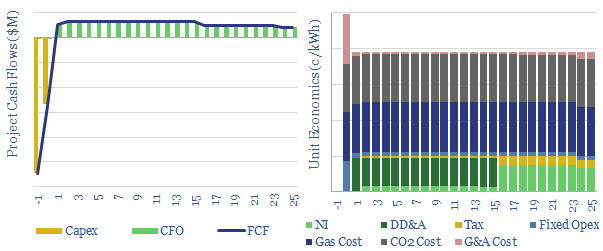
Greenfield coal-to-power economics vary markedly by region. IRRs can reach 30% in emerging markets with low capex costs, high utilization and no carbon prices. But they fail to return their capital costs under developed world air standards and $25/ton CO2 pricing. Please download the model to stress-test the economics.
-
Renewable diesel: the economics?
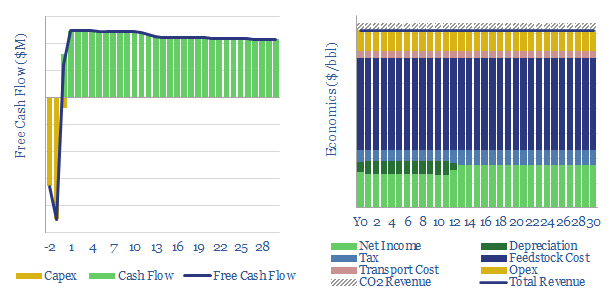
Our base case is that a US renewable diesel facility must achieve $4.6/gallon sales revenues (which is c$200/bbl) as it commercializes a product with up to 75% lower embedded emissions than conventional diesel. Similarly, a bio-diesel facility must achieve $3.6/gallon sales on a product with 60% lower embedded emissions.
-
Energy transition technologies: the pace of progress?
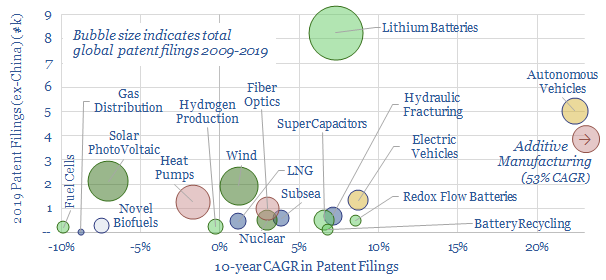
This data-file captures over 250,000 patents (ex-China) to assess the pace of progress in different energy transition technologies, yielding insights into batteries (high activity), autonomous vehicles and additive manufacturing (fastest acceleration), wind and solar (maturing), fuel cells and biofuels (waning) and other technologies.
-
Additive manufacturing: technology leaders?
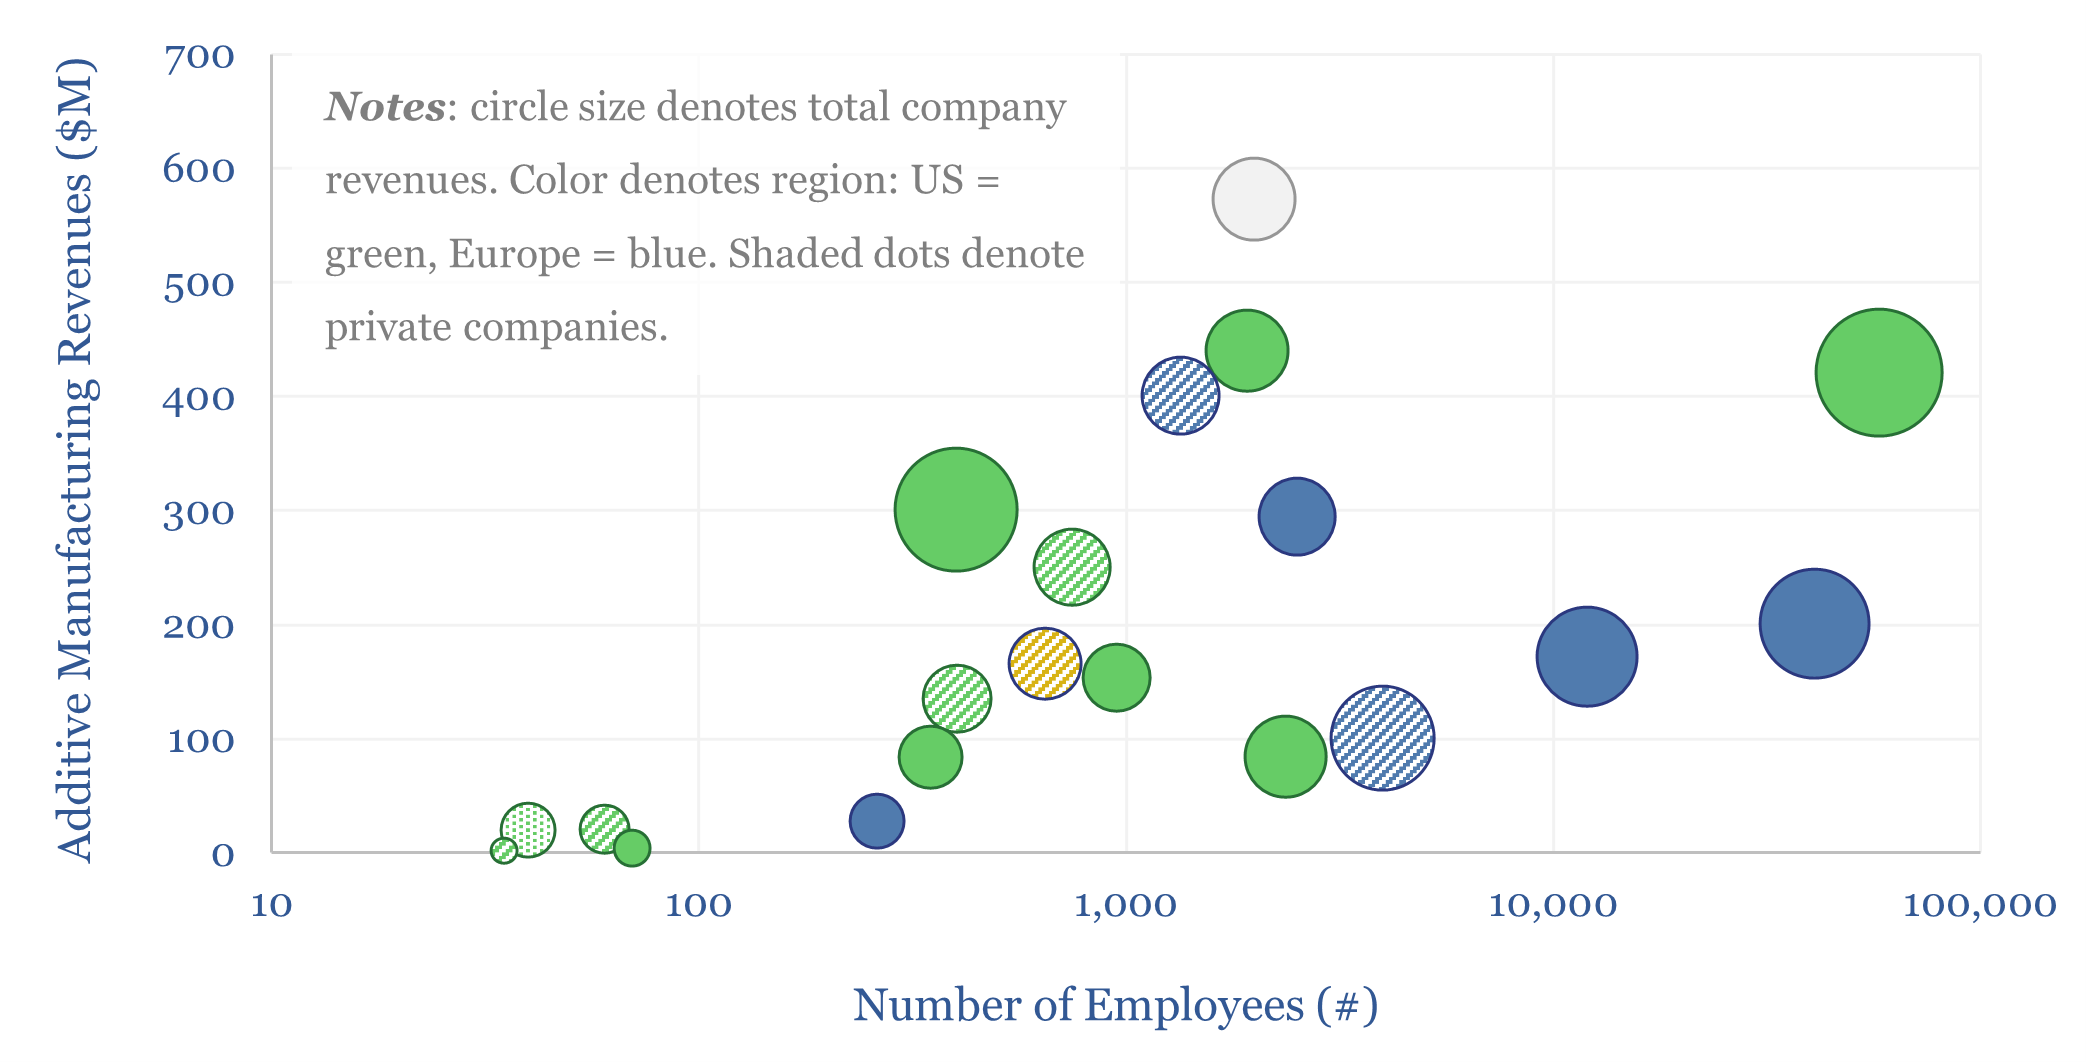
Additive manufacturing companies are screened in this data-file, across 20 technology leaders. We have also tabulated 25 case studies, where AM reduces weight by 40%, cost by 50%, and lead-time by 60%. The industry remains highly competitive. But could it be turning a corner? Especially for metal components in capital goods and aerospace?
-
Manufacturing utilization rates by industry?
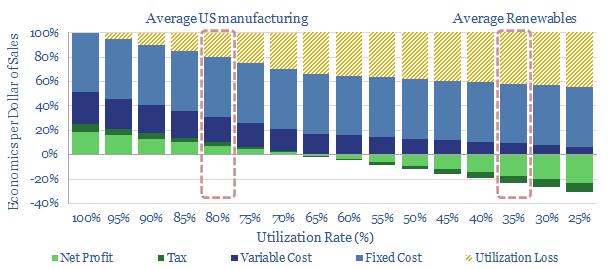
This data-file tabulates the utilization rates of different industries over time, based on a variety of data sources. Manufacturing utilization rates ran at almost 80% prior to the COVID crisis, underpinning 11% of US GDP and 25% of US energy consumption. No manufacturing industry can realistically be profitable running at the c35% utilization rates of…
-
Hydrogen storage: the economics?
This model captures the costs of storing hydrogen, which appear to be much higher than storing natural gas. We estimate a $2.50/kg storage spread may be needed to earn a 10% IRR on a $500/kg storage facility, while costs could be deflated to $0.5/kg if nearby salt caverns are available and projects are large and…
-
Green Hydrogen Economy: Holy Roman Empire?
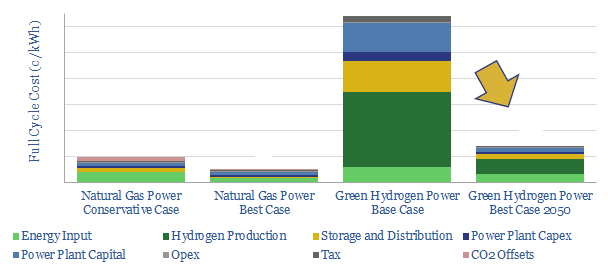
We model the green hydrogen value chain: harnessing renewable energy, electrolysing water, storing the hydrogen, then generating usable power in a fuel cell. Today’s costs are very high, at 64c/kWh. Even by 2050, our best case scenario is 14c/kWh, which elevates household electricity bills by $440-990/year compared with decarbonizing natural gas.
Content by Category
- Batteries (89)
- Biofuels (44)
- Carbon Intensity (49)
- CCS (63)
- CO2 Removals (9)
- Coal (38)
- Company Diligence (95)
- Data Models (840)
- Decarbonization (160)
- Demand (110)
- Digital (60)
- Downstream (44)
- Economic Model (205)
- Energy Efficiency (75)
- Hydrogen (63)
- Industry Data (279)
- LNG (48)
- Materials (82)
- Metals (80)
- Midstream (43)
- Natural Gas (149)
- Nature (76)
- Nuclear (23)
- Oil (164)
- Patents (38)
- Plastics (44)
- Power Grids (130)
- Renewables (149)
- Screen (117)
- Semiconductors (32)
- Shale (51)
- Solar (68)
- Supply-Demand (45)
- Vehicles (90)
- Wind (44)
- Written Research (354)