Search results for: “power electronics”
-
Demand shifting: electrical flexibility by industry?
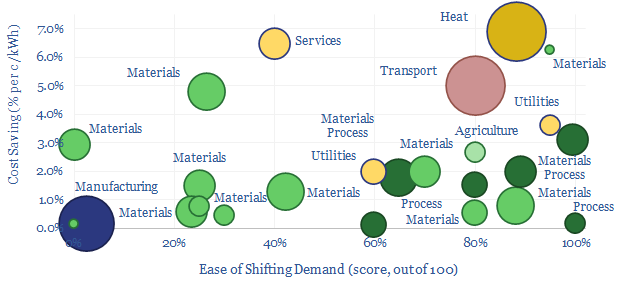
Demand shifting flexes electrical loads in a power grid, to smooth volatility and absorb more renewables. This database scores technical potential and economical potential of different electricity-consuming processes to shift demand, across materials, manufacturing, industrial heat, transportation, utilities, residential HVAC and commercial loads.
-
Electrochemistry: battery voltage and the Nernst Equation?
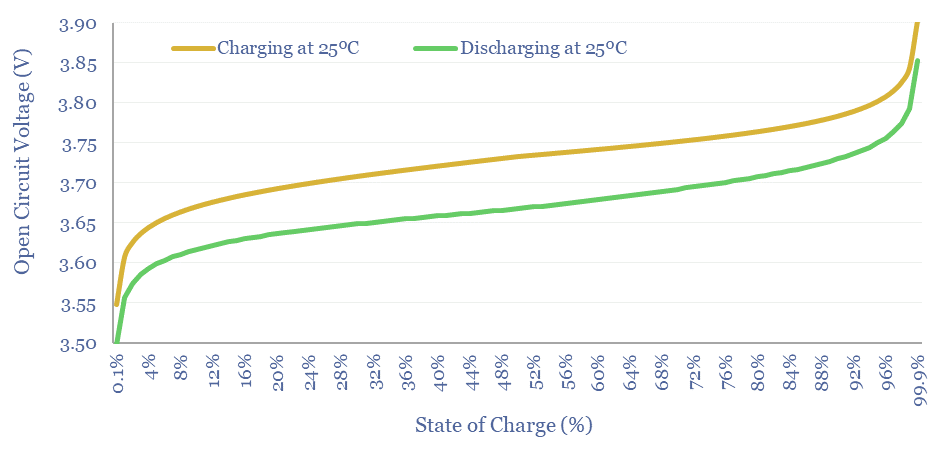
What determines the Voltage of an electrochemical cell, such as a lithium ion battery, redox flow battery, a hydrogen fuel cell, an electrolyser or an electrowinning plant? This note explains electrochemical voltages, from first principles, starting with Standard Potentials and the Nernst Equation.
-
HVDC transmission: leading companies?
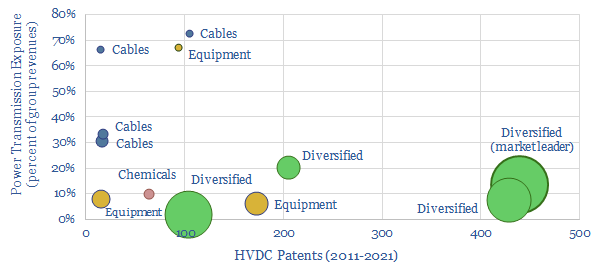
The global HVDC market is $10bn pa, and it might typically cost c€100-600 M to connect a large and remote renewables project to the grid or run a small HVDC inter-connector. This data-file reviews the market leaders in HVDC, based on 5,500 patents. A dozen companies stand out, with c$40bn of combined revenues from power…
-
Solar volatility: second by second output data?
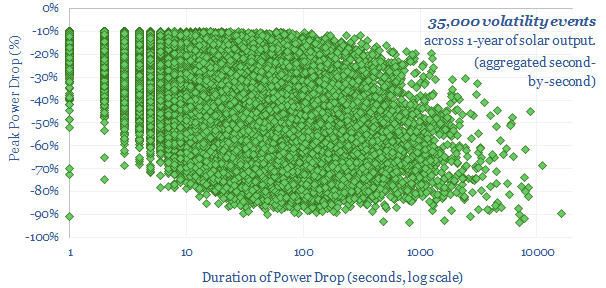
We have aggregated the volatility and power drops across an entire year of second-by-second solar data. Each day typically sees 100 volatility events where output drops by over 10%, and 10 events where output drops by over 70 events. Volatility also varies day by day.
-
India: electricity demand and power grid over time?
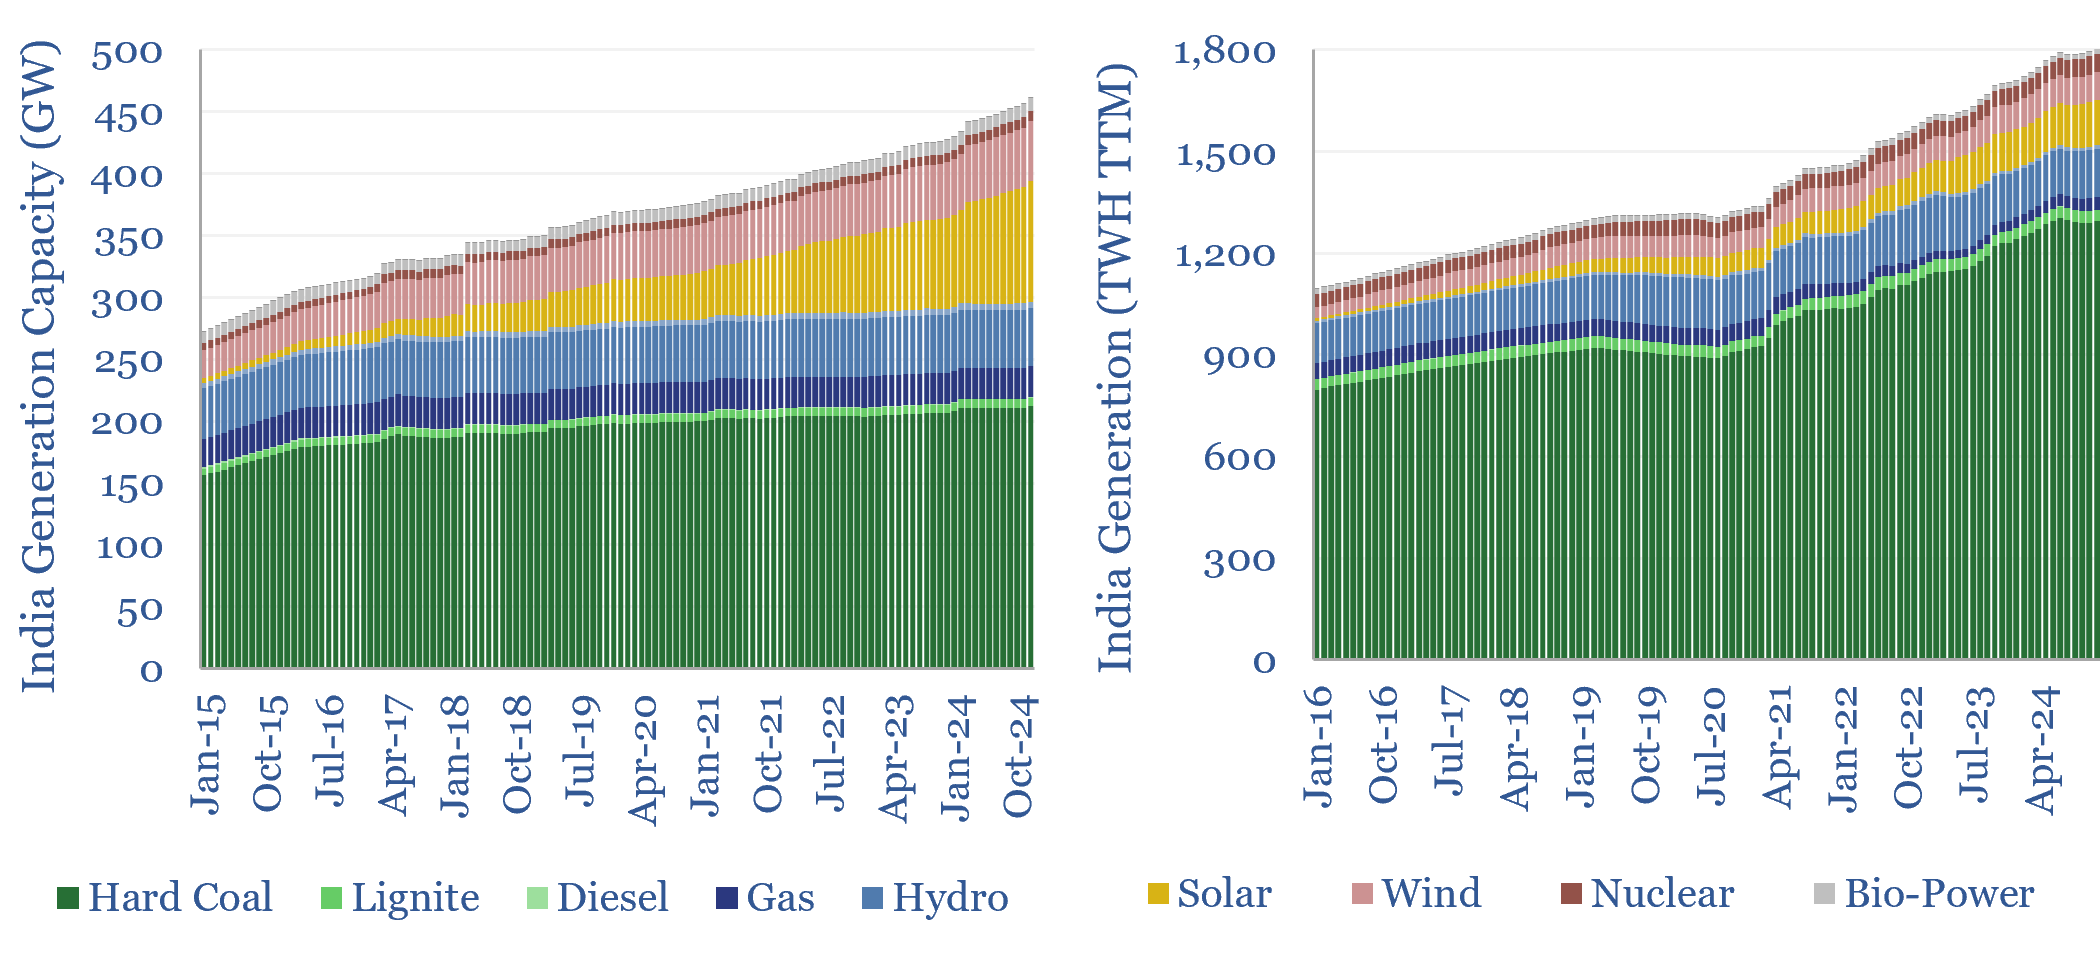
India’s electricity demand is growing by 6-8% (+100-140 TWH) per year, but 75% of the total still comes from coal, which has itself grown at a 5% CAGR over the past half-decade. Wind and solar would need to grow 4x faster than 2023 levels for thermal generation just to flatline. What implications and opportunities for…
-
Vehicles: energy transition conclusions?
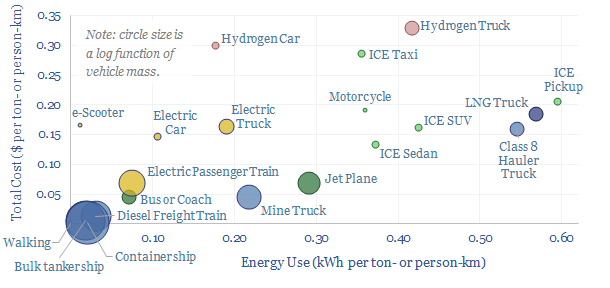
Vehicles transport people and freight around the world, explaining 70% of global oil demand, 30% of global energy use, 20% of global CO2e emissions. This overview summarizes all of our research into vehicles, and key conclusions for the energy transition.
-
Semiconductors: outlook in energy transition?

Semiconductors are an energy technology. And they are transforming the future global energy complex, across AI, solar, electric vehicles, LEDs and other new energies. This short article summarizes our outlook for semiconductors in energy transition, and resultant opportunities across our work.
-
Solar volatility: tell me lies, tell me sweet little lies?
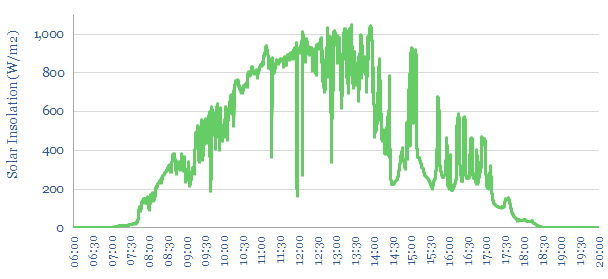
This 20-page note quantifies the statistical distribution of short-term volatility at solar power plants. Solar output typically flickers downwards by over 10%, around 100 times per day. Can industrial processes truly be ‘powered by solar’? What opportunities will arise to buffer the volatility?
-
Gas power: does low utilization entail spare capacity?
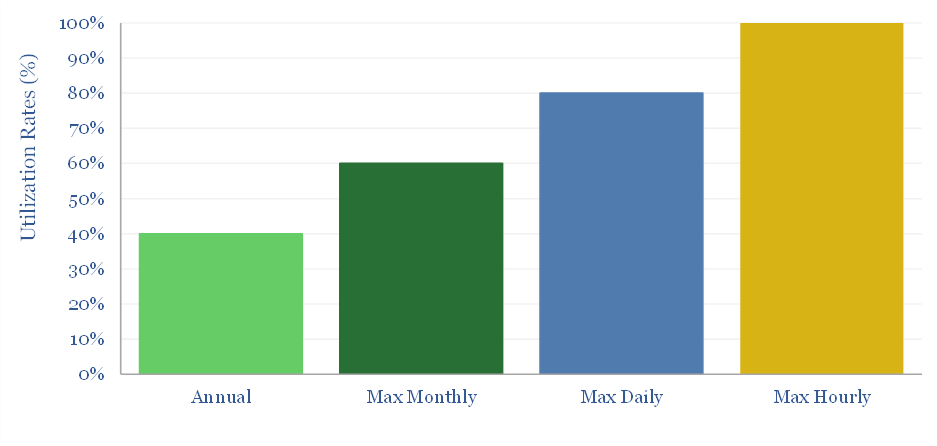
The US has >400GW of large gas-fired power plants running at 40% average annual utilization. Could they help power new loads, e.g., 60GW of AI data-centers by 2030? This 5-page note shows why low utilization does not entail spare capacity, and in turn, estimates the true spare capacity for loads such as data-centers.
Content by Category
- Batteries (87)
- Biofuels (42)
- Carbon Intensity (49)
- CCS (63)
- CO2 Removals (9)
- Coal (38)
- Company Diligence (92)
- Data Models (822)
- Decarbonization (159)
- Demand (110)
- Digital (58)
- Downstream (44)
- Economic Model (200)
- Energy Efficiency (75)
- Hydrogen (63)
- Industry Data (275)
- LNG (48)
- Materials (81)
- Metals (74)
- Midstream (43)
- Natural Gas (146)
- Nature (76)
- Nuclear (23)
- Oil (162)
- Patents (38)
- Plastics (44)
- Power Grids (124)
- Renewables (149)
- Screen (112)
- Semiconductors (30)
- Shale (51)
- Solar (67)
- Supply-Demand (45)
- Vehicles (90)
- Wind (43)
- Written Research (347)
