Search results for: “renewables”
-
Copper: the economics?
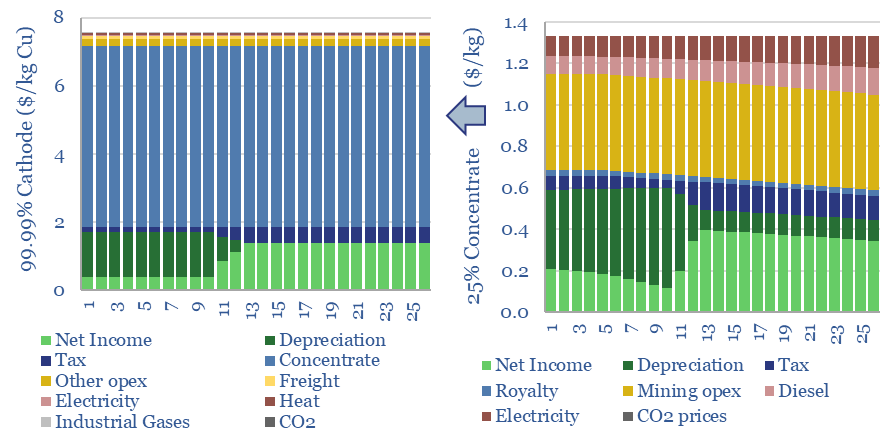
The economic cost of copper production is build up from first princples in this model, from mine, to concentrator, to smelter to 99.99% pure copper cathodes. Our base case is $7.5/kg copper cathode, with 4 tons/ton CO2 intensity, after starting from an 0.57% ore grade. Numbers vary sharply and can be stress-tested in the data-file.
-
TSE Patent Assessments: a summary?
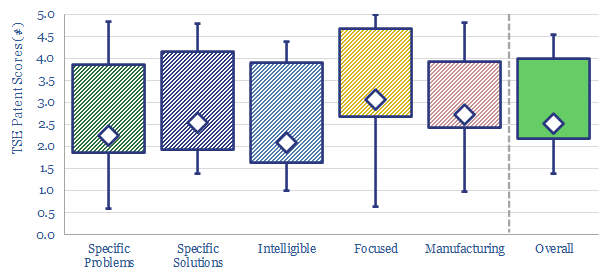
This data-file aggregates all of our patent assessments into a single reference file, so different companies’ scores can be compared and contrasted. Our average score is 3.5 out of 5.0. Skew is to the downside. Intelligibility is the biggest challenge. Scores correlate with TRL and revenues.
-
Is the world investing enough in energy?
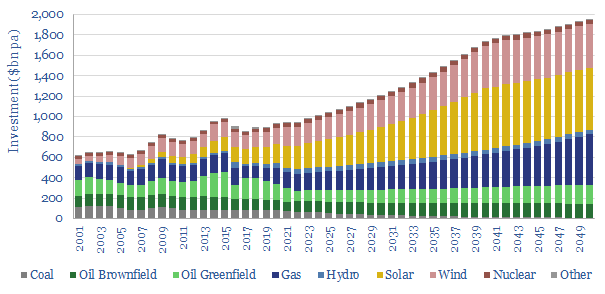
Global energy investment in 2020-21 has been running 10% below the level needed on our roadmap to net zero. Under-investment is steepest for solar, wind and gas. Under-appreciated is that each $1 dis-invested from fossil fuels must be replaced with $25 in renewables. Future capex needs are vast.
-
Global coal supply-demand: outlook in energy transition?
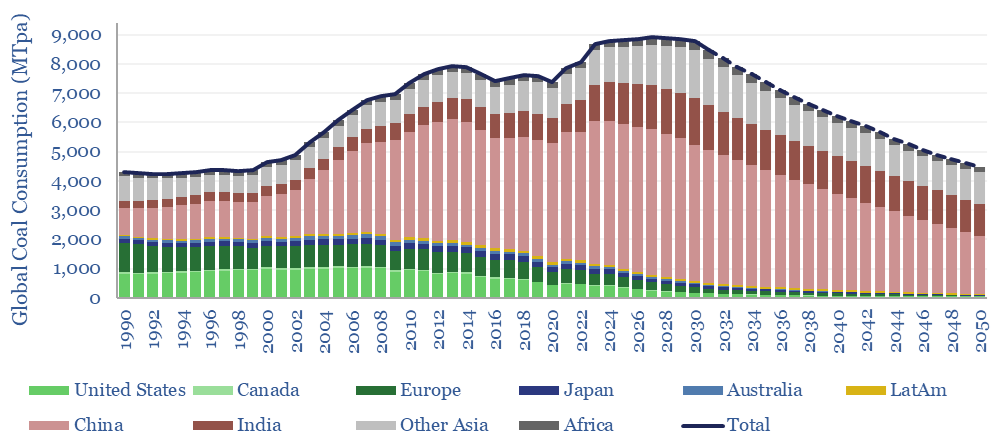
Global coal use likely hit a new all-time peak of 8.8GTpa in 2024, of which 7.6GTpa is thermal coal and 1.1GTpa is metallurgical. The largest consumers are China (5GTpa), India (1.3GTpa), other Asia (1.2GTpa), Europe (0.4GTpa) and the US (0.4GTpa). This model presents our forecasts for global coal supply-demand from 1990 to 2050.
-
Global energy: supply-demand model?
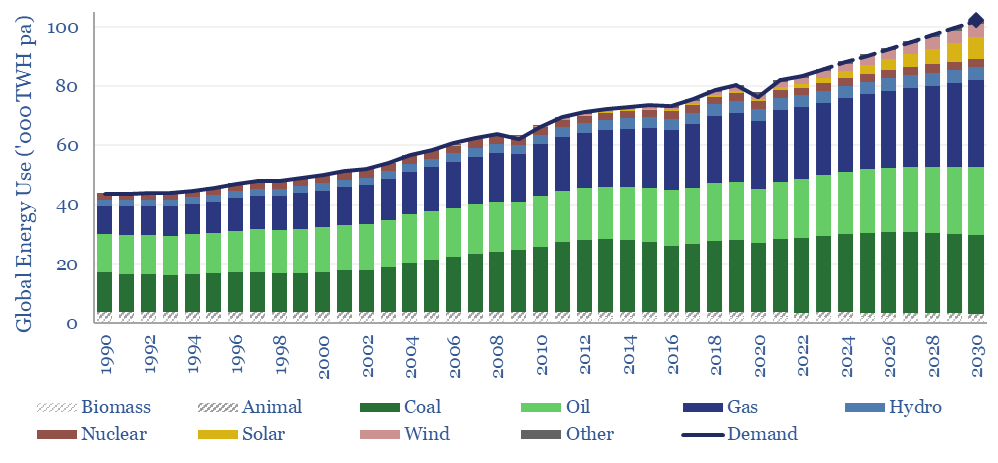
This global energy supply-demand model combines our supply outlooks for coal, oil, gas, LNG, wind and solar, nuclear and hydro, into a build-up of useful global energy balances in 2023-30. Energy markets can be well-supplied from 2025-30, barring and disruptions, but only because emerging industrial superpowers will continuing using high-carbon coal.
-
European energy use: by industry, by fuel, by country?
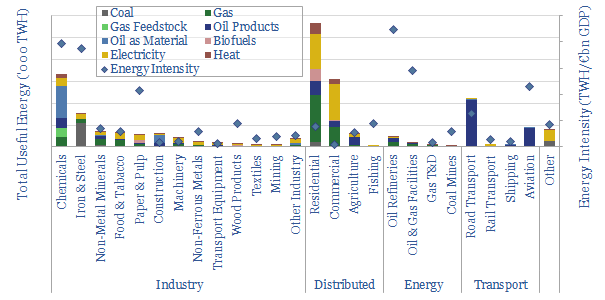
Europe comprises 7% of the world’s population, and 17% of its energy use. The purpose of this data-file is to disaggregate the energy use across 25 industries, six energy types and 28 countries. The data-file were updated in 2025, reflecting lagged Eurostat data from 2023.
-
Power-MOSFETs: leading companies?
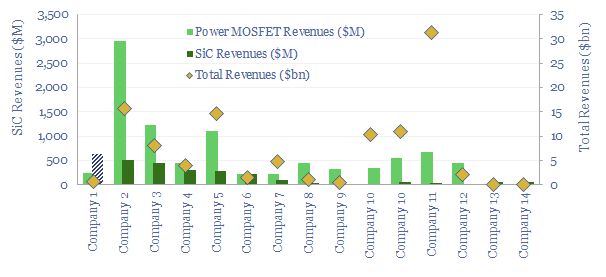
Power MOSFETs are an energy transition technology, the building block behind inverters, DC-DC converters, EV drive trains, EV chargers and other renewables-battery interfaces. Hence this data-file is a screen of companies making power MOSFETs, especially new and higher-efficiency devices using Silicon Carbide as the semi-conductor.
-
Oil storage terminals: the economics?
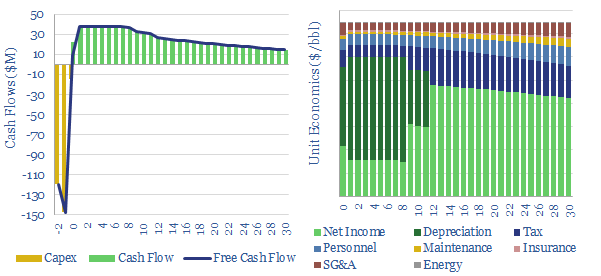
This data-file captures the economics of constructing an oil storage terminal (aka a “tank farm”). A typical facility needs to charge a $1.5/bbl storage spread to earn a 10% IRR over a 30-year life. Capex costs per kWh of energy are 97% lower than grid-scale batteries. It may become more challenging to finance new facilities…
-
Global LNG: offtake contracts and spot market development?
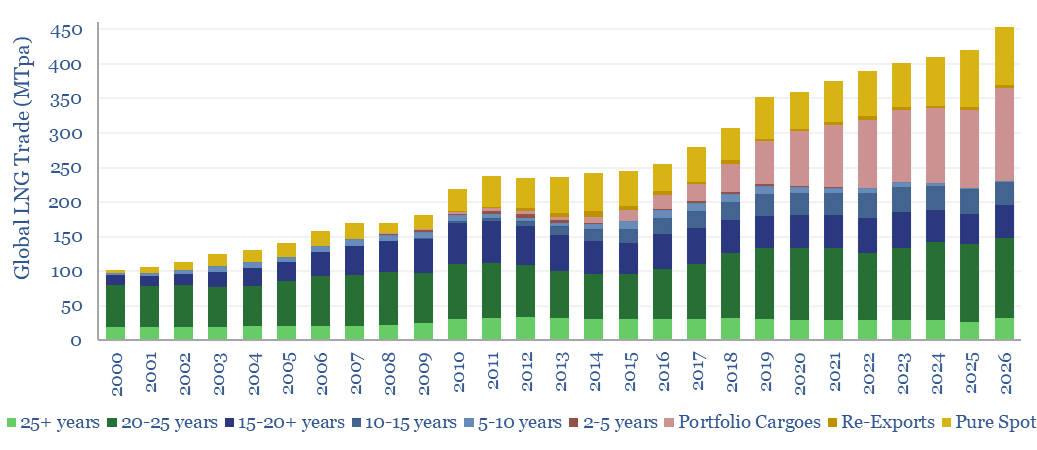
This database of global LNG contracts tabulates the details for 450 LNG offtake contracts, tracking buyers, sellers, facilities, contract durations and destination flexibility. The total market has grown by 3x in the past 20-years to 400MTpa in 2023, while the spot and short-term market has increased by 10x to 150MTpa.
-
High voltage transmission cables: power parameters?
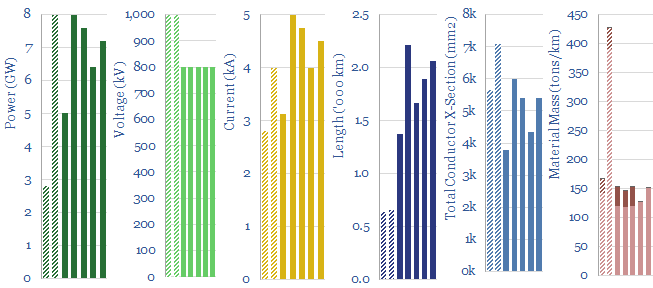
This data-file aggregates technical parameters of ultra high-voltage power lines. The average one transmits 6.5GW, at 800-1,000kV and 4,000 Amps, over a distance of 1,500 km. Every 500 meters, there is a 70m tall tower. The power lines have total mass of 200 tons/km, 2-3% losses per 1,000km and c$3M/mile costs.
Content by Category
- Batteries (89)
- Biofuels (44)
- Carbon Intensity (49)
- CCS (63)
- CO2 Removals (9)
- Coal (38)
- Company Diligence (95)
- Data Models (840)
- Decarbonization (160)
- Demand (110)
- Digital (60)
- Downstream (44)
- Economic Model (205)
- Energy Efficiency (75)
- Hydrogen (63)
- Industry Data (279)
- LNG (48)
- Materials (82)
- Metals (80)
- Midstream (43)
- Natural Gas (149)
- Nature (76)
- Nuclear (23)
- Oil (164)
- Patents (38)
- Plastics (44)
- Power Grids (130)
- Renewables (149)
- Screen (117)
- Semiconductors (32)
- Shale (51)
- Solar (68)
- Supply-Demand (45)
- Vehicles (90)
- Wind (44)
- Written Research (354)