Search results for: “transmission”
-
Peak power demand by region (and case studies)

This data-file tracks the timing and magnitude of peak power demand, across different grids in the North Hemisphere, with case studies. This matters for grid-planning, gas peakers and batteries. In the US, peak demand is typically driven by high AC loads in summer heatwaves. In Europe’s milder climate, only c10% of homes have AC, and…
-
LNG plant compression: gas drives vs electric motors?
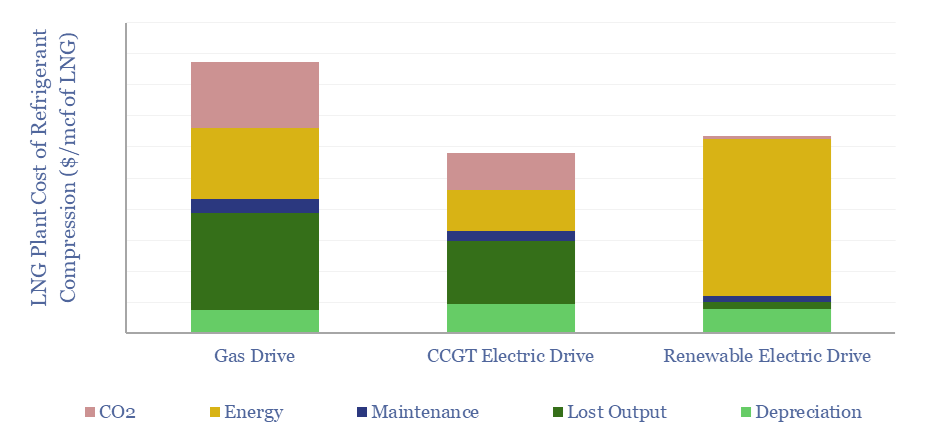
This data-file compares the costs of refrigerant compression at LNG plants, using gas turbines, electric motors powered by on-site CCGTs, or electric motors powered by renewable electricity. eLNG has higher capex costs, but higher efficiency, lower opex, and short payback times. Numbers in $/mcf and $/MTpa can be stress-tested in the data-file.
-
Electric vehicle cost breakdown by component?
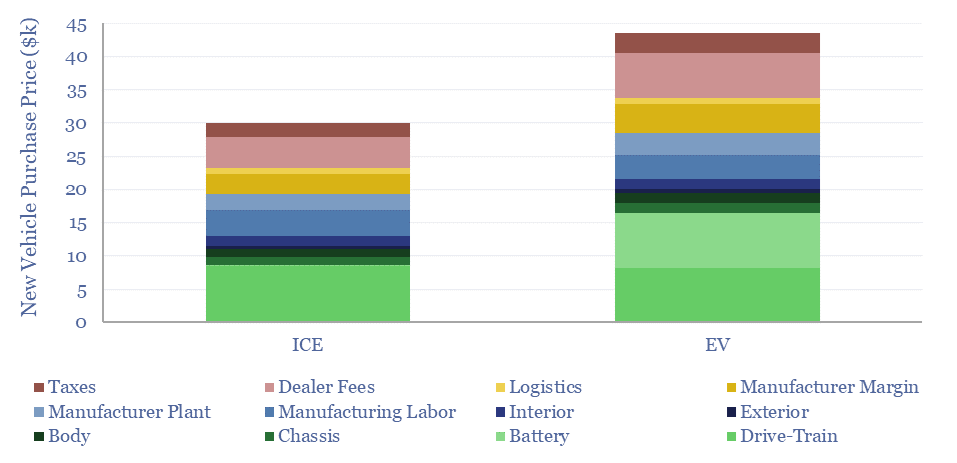
This data-file disaggregates the $30k total cost of a typical new ICE and the c$45k total cost of a typical new EV, as a sum-of-the-parts, across 25 cost lines. Drivetrain costs are similar at $8-9k each. The key challenge for the EV is the battery. The electric vehicle cost breakdown shows promise for improving power…
-
Global energy demand by end use?
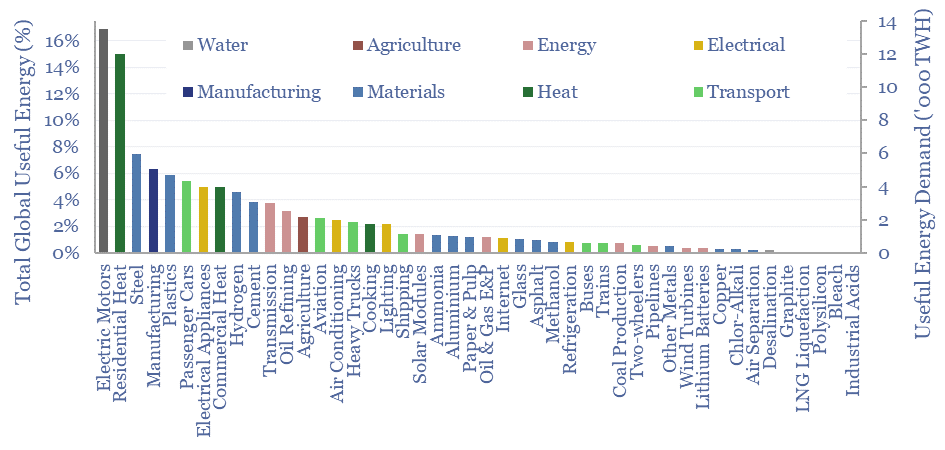
This data-file is a breakdown of global energy demand by end use, drawing across our entire research library, to disaggregate the global energy system across almost 50 applications, across transportation, heat, electricity, materials and manufacturing. Numbers, calculations, efficiencies and heating temperatures are in the data-file.
-
Electricity demand for electric vehicles?
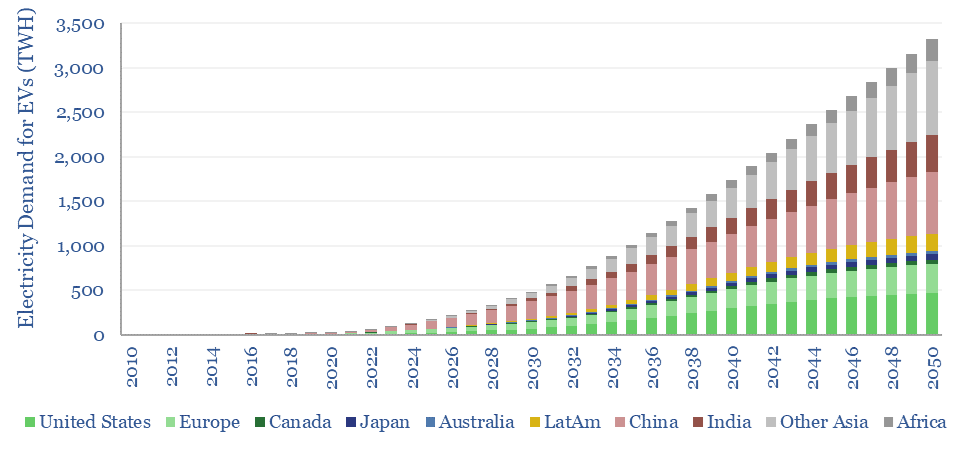
Global electricity demand for electric vehicles will rise from 120TWH in 2024 to 500 TWH in 2030 and 3,300 TWH in 2050, ultimately adding 11% upside to today’s global electricity demand, as part of our roadmap to net zero. This data-file quantifies electricity demand for EVs by region and over time, including data into the…
-
Residential energy prices: reasons for optimism?
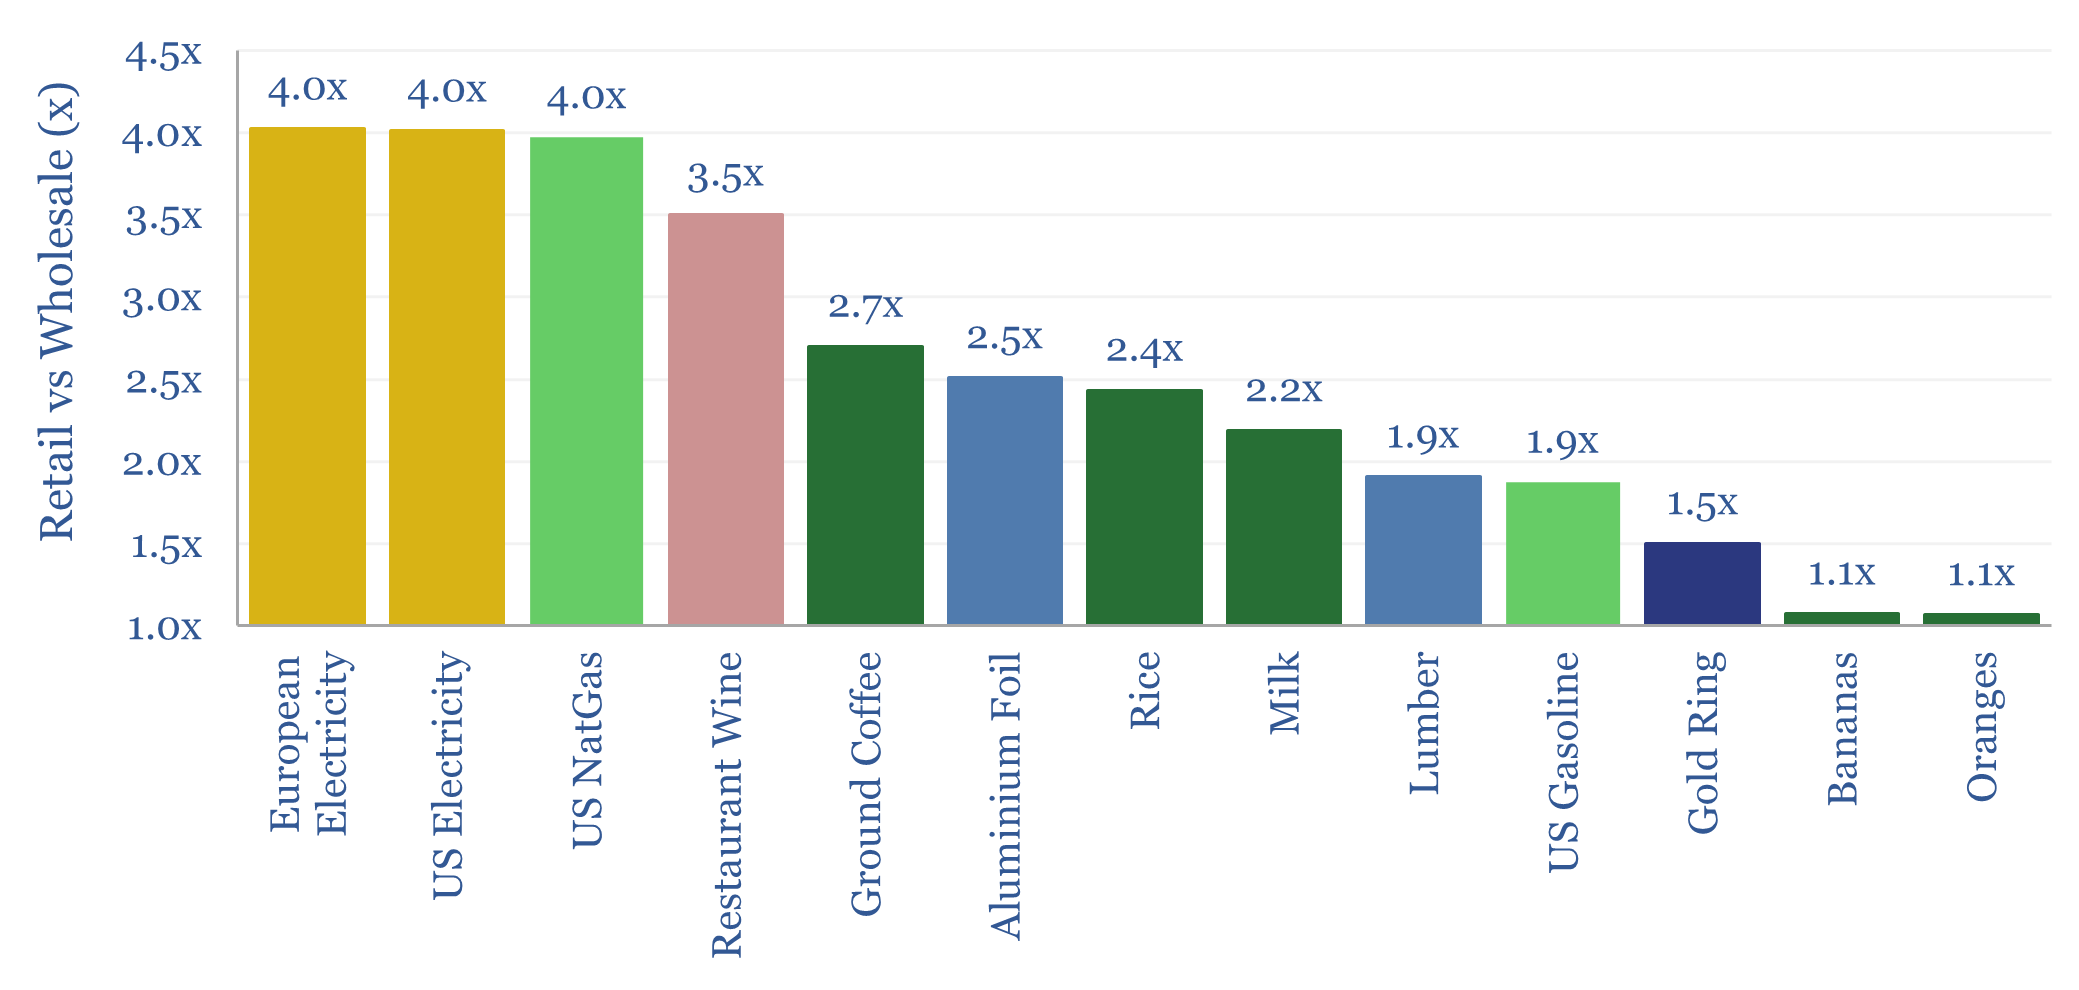
Residential energy prices tend to run 4x higher than underlying wholesale energy prices. This is a very wide margin, as by contrast, typical commoditized products in supermarkets are usually only marked up by about 2x, compared to their wholesale prices. Today’s data-file compares retail prices vs wholesale prices across a dozen different categories. A remarkable…
-
Engineering and construction companies screen?
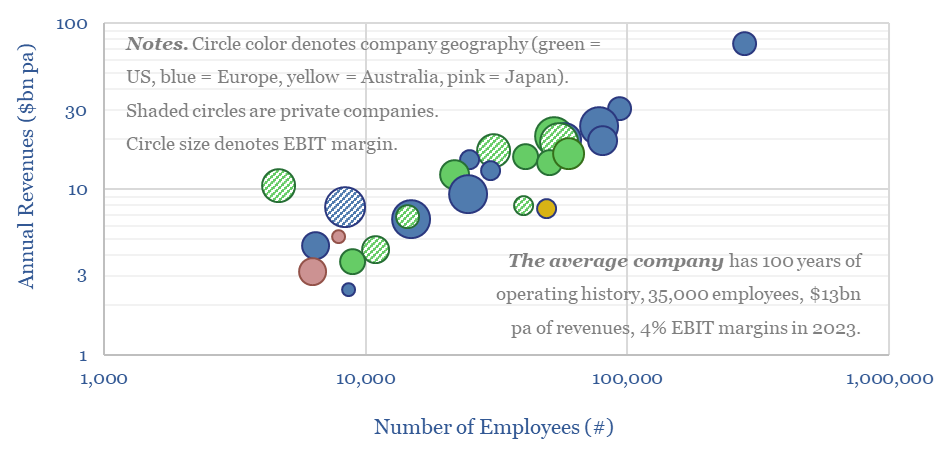
40% of total installed project costs tend to accrue to construction companies, as screened in this data-file. The average of 25 large engineering and construction companies has 100 years of operating history, 35,000 employees, generated $13bn pa of revenues in 2023, and at a c4% EBIT margins.
-
Superconductor screen: projects, materials, companies?
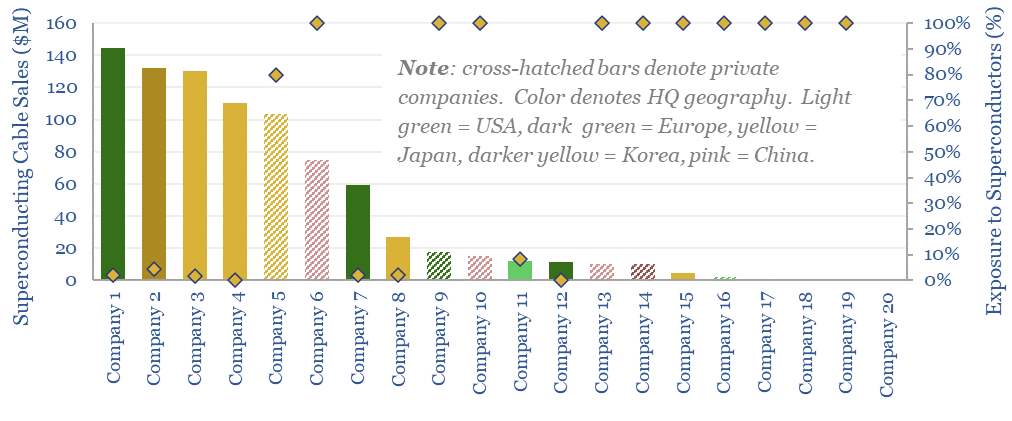
This superconductor screen summarizes all of our work into superconductors, screening past projects, active companies, superconductor materials and the properties of commercial HTS tapes. Five listed companies in Europe, Japan and the US are particularly important for superconducting cable projects to relieve grid bottlenecks?
-
Renewables: share of global energy and electricity by country?
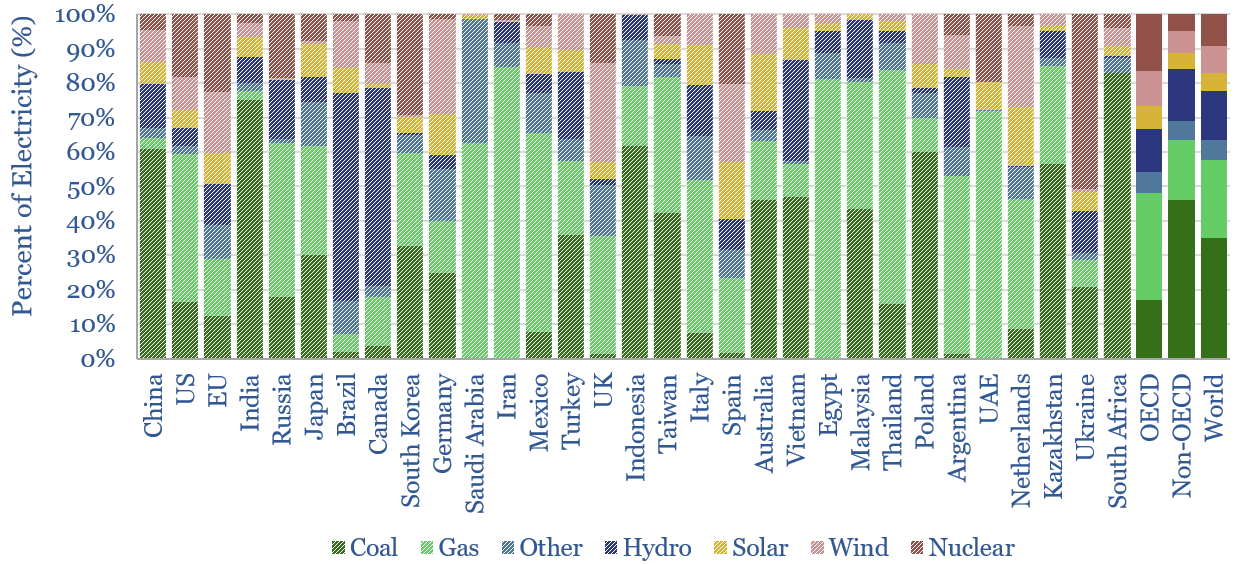
This data-file is an Excel “visualizer” for some of the key headline metrics in global energy: such as total global energy use, electricity generation by source and growing renewables penetration; broken down country-by-country, and showing how these metrics have changed over time.
-
Load profiles in power grids?
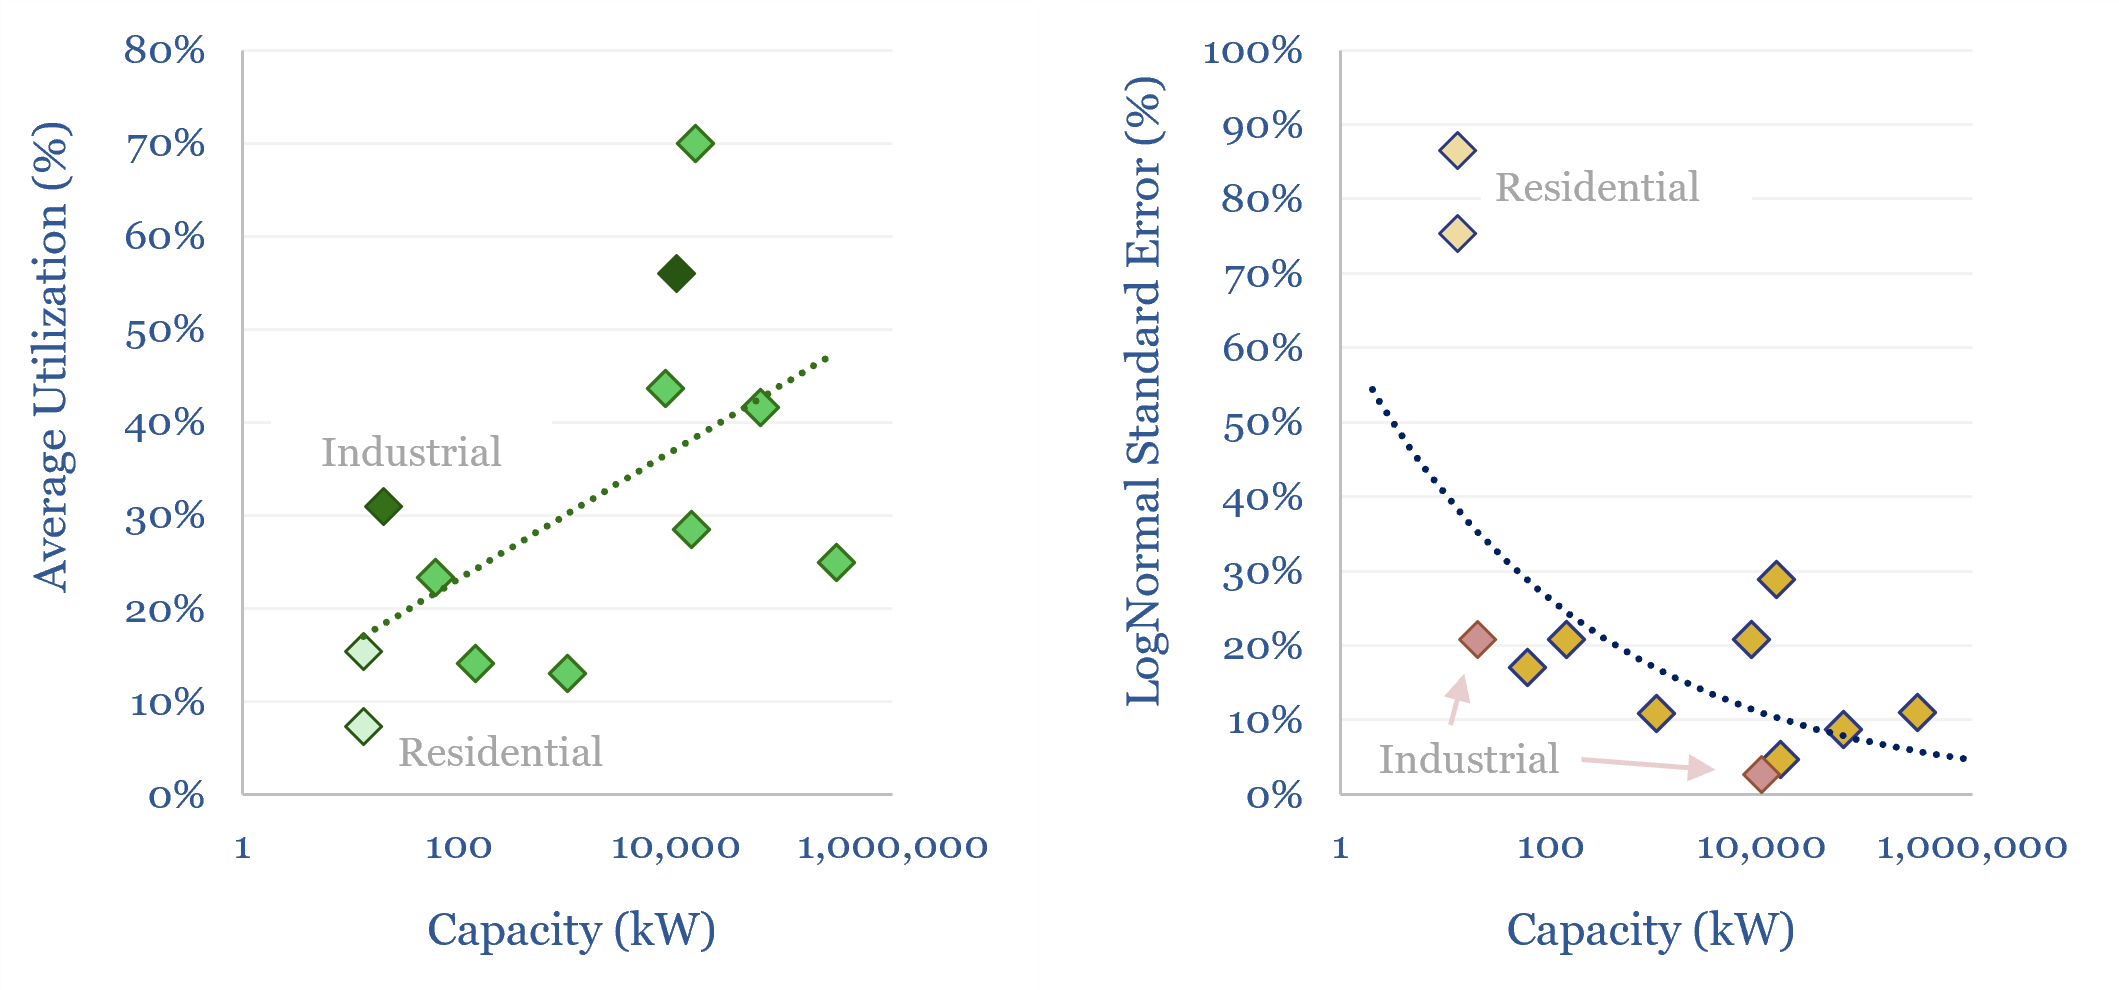
Load profiles depict how the power running through a particular cross-section of the grid varies over time, ranging from individual homes, through giant GVA-scale transmission lines. Load profile data are unfortunately not widely available, however, we have aggregated a dozen case studies from technical papers, in this data-file, to help decision-makers with grid-modeling.
Content by Category
- Batteries (87)
- Biofuels (42)
- Carbon Intensity (49)
- CCS (63)
- CO2 Removals (9)
- Coal (38)
- Company Diligence (92)
- Data Models (822)
- Decarbonization (159)
- Demand (110)
- Digital (58)
- Downstream (44)
- Economic Model (200)
- Energy Efficiency (75)
- Hydrogen (63)
- Industry Data (275)
- LNG (48)
- Materials (81)
- Metals (74)
- Midstream (43)
- Natural Gas (146)
- Nature (76)
- Nuclear (23)
- Oil (162)
- Patents (38)
- Plastics (44)
- Power Grids (124)
- Renewables (149)
- Screen (112)
- Semiconductors (30)
- Shale (51)
- Solar (67)
- Supply-Demand (45)
- Vehicles (90)
- Wind (43)
- Written Research (347)