Search results for: “volatility”
-
Energy transition: top commodities?
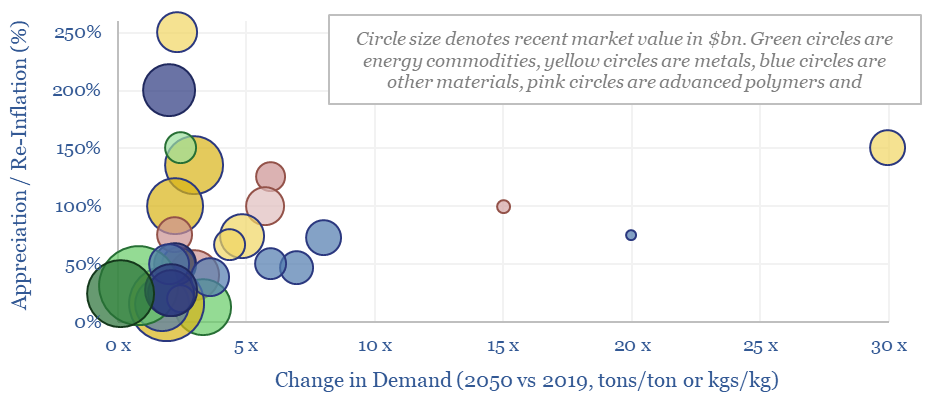
This data-file summarizes our latest thesis on ten commodities with upside in the energy transition. The average one will see demand rise by 3x and price/cost appreciate or re-inflate by 100%. The data-file contains a 6-10 line summary of our work into each commodity.
-
US shale: outlook and forecasts?
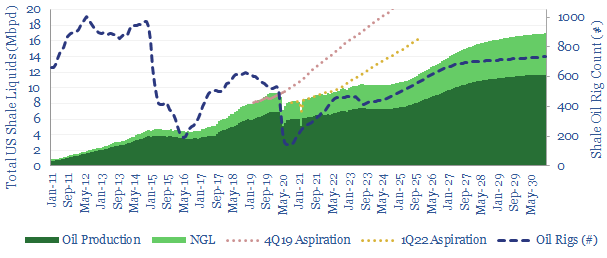
This model sets out our US shale production forecasts by basin. It covers the Permian, Bakken and Eagle Ford, as a function of the rig count, drilling productivity, completion rates, well productivity and type curves. US shale likely adds +1Mbpd/year of production growth from 2023-2030, albeit flatlining in 2024, then re-accelerating on higher oil prices?
-
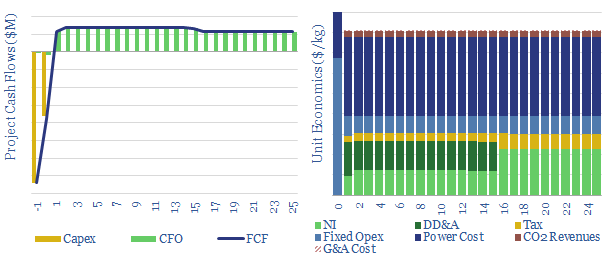
Gas power: levelized costs of combined cycle gas turbines?
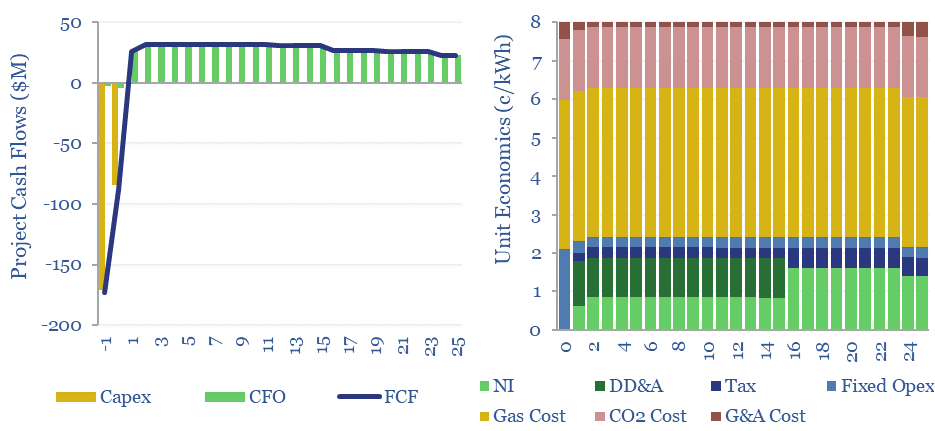
Levelized costs of combined cycle gas turbines are built up in this data-file. Our base case costs of gas-fired power generation are 8c/kWh, at a combined cycle turbine converting 55% of the thermal energy of natural gas into electrical energy, for a total CO2 intensity of 0.35 kg/kWh.
-
Scaling Up Renewables and Batteries
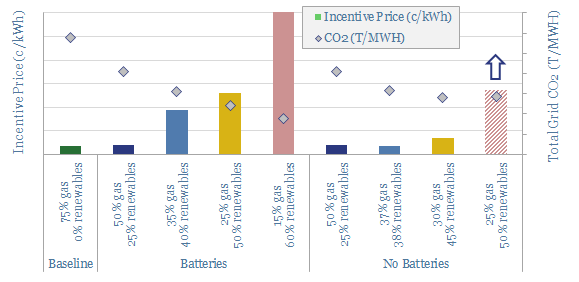
Renewables would cap out at 40-50% of inflexible electricity grids, based on Monte Carlo analysis of wind, solar and batteries. Beyond 50%, new renewables’ curtailment rates surpass 70%, trebling their marginal cost. Batteries also increase incentive prices by 5-25x. Natural gas and demand-shifting are the best backstops.
-
Green hydrogen: the economics?
We have modelled the economics of a green hydrogen project, electrolysing water using renewable energy. An H2 price of $8/kg ($60/mcfe) is required to earn a 10% return. Costs data are captured. The most challenging input variable is not capex cost or efficiency, but utilization rate, if the project is to be truly green.
-
Levelized cost of electricity: stress-testing LCOE?
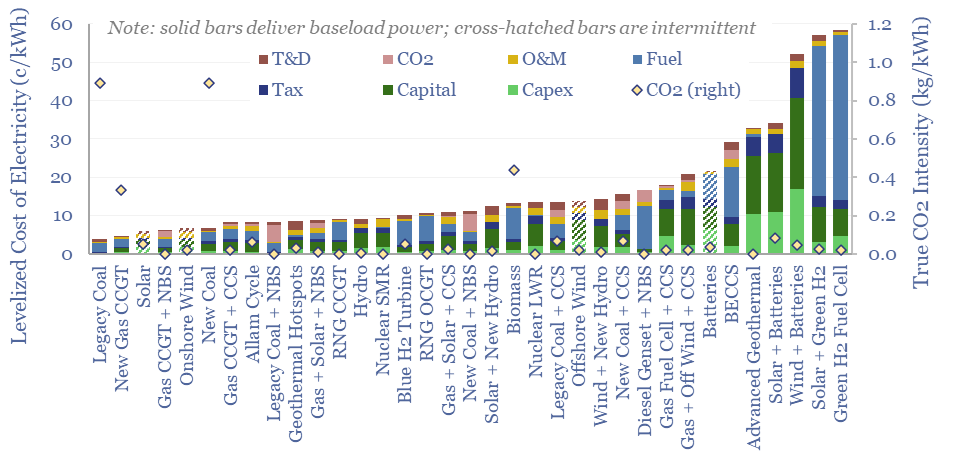
This data-file summarizes the levelized cost of electricity, across 35 different generation sources, covering 20 different data-fields for each source. Costs of generating electricity can vary from 2-200 c/kWh. The is more variability within categories than between them. Numbers can readily be stress-tested in the data-file.
-
Desalination by reverse osmosis: the economics?
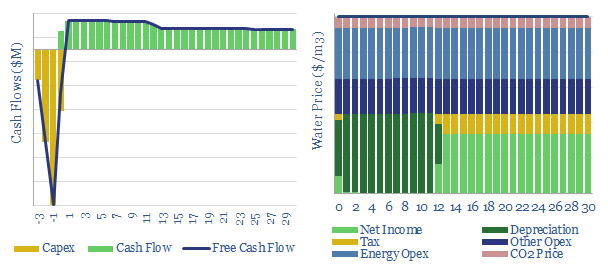
35bn tons of desalinated water are produced each year, absorbing 250 TWH of energy, or 0.4% of total global energy consumption. These numbers will likely rise, due to demographic trends, and due to climate change. Desalination costs average $1.0/m3, use 3.5kWh/m3 of electricity and can demand shift.
-
Manufacturing utilization rates by industry?
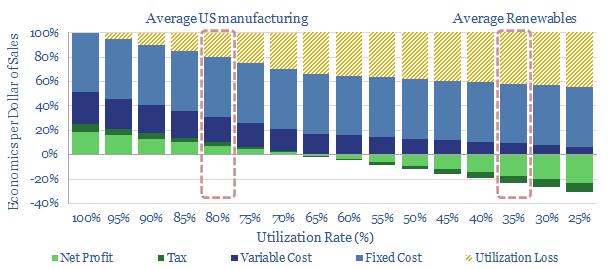
This data-file tabulates the utilization rates of different industries over time, based on a variety of data sources. Manufacturing utilization rates ran at almost 80% prior to the COVID crisis, underpinning 11% of US GDP and 25% of US energy consumption. No manufacturing industry can realistically be profitable running at the c35% utilization rates of…
-
Wind power: decline rates?
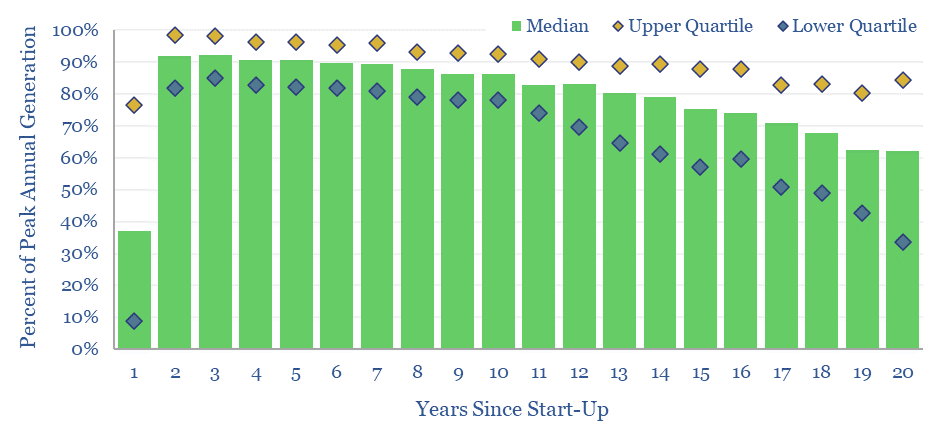
This data-file aggregates wind generation by facility, across the US, at 1,400 wind farms, going back 20-years. Wind power decline rates average 1% per year, then possibly accelerate to 3-4% per year in years 10-20. However wind generation is also noisy, typically varying +/- 7% YoY. This matters for the economics and ultimate share of…
-
Smart Energy: technology leaders?
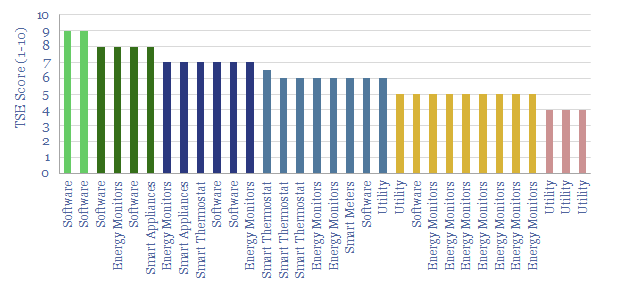
Smart meters and smart devices are capable of transmitting and receiving real-time consumption data and instructions. This data-file tracks 40 leading companies, mostly at the venture and growth stages. They help lower demand, smooth grid volatility and encourage appliance upgrades.
Content by Category
- Batteries (85)
- Biofuels (42)
- Carbon Intensity (49)
- CCS (63)
- CO2 Removals (9)
- Coal (38)
- Company Diligence (87)
- Data Models (801)
- Decarbonization (156)
- Demand (106)
- Digital (51)
- Downstream (44)
- Economic Model (196)
- Energy Efficiency (75)
- Hydrogen (63)
- Industry Data (266)
- LNG (48)
- Materials (79)
- Metals (70)
- Midstream (43)
- Natural Gas (144)
- Nature (75)
- Nuclear (22)
- Oil (161)
- Patents (38)
- Plastics (44)
- Power Grids (118)
- Renewables (148)
- Screen (109)
- Semiconductors (30)
- Shale (50)
- Solar (67)
- Supply-Demand (45)
- Vehicles (90)
- Wind (41)
- Written Research (339)