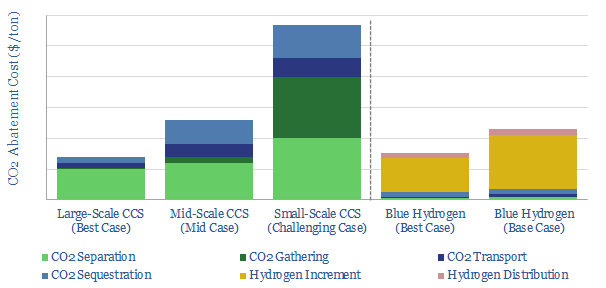
Carbon capture is cursed by colossal costs at small scale. But blue hydrogen may be its saviour. Crucial economies of scale are guaranteed by deploying both technologies together. The combination is a dream scenario for gas producers. This 22-page note outlines the opportunity and costs.
The mechanics of carbon capture and storage projects are explained on pages 2-4, assessing the costs of CO2 capture, CO2 transport and CO2 disposal in turn.
However CCS faces challenges, which are outlined on pages 4-5. In particular, CO2 has three ‘curses’ at small scale, which dramatically inflate the costs.
We quantify the three curses’ impacts. They are diffuse CO2 concentrations (pages 6-8), high fixed costs for pipelines and disposal facilities (pages 8-10) and difficulties gathering CO2 from dispersed turbines and boilers (pages 10-11).
The rationale for blue hydrogen is to overcome these challenges with CCS, as explained on page 12.
Different blue hydrogen reactor designs are discussed, and their economics are modelled on pages 13-15. Autothermal reforming should take precedence over steam methane reforming as part of the energy transition.
Midstream challenges remain. But we find they are less challenging for blue hydrogen than for green hydrogen on page 16.
A scale-up of blue hydrogen is a dream scenario for the gas industry. The three benefits are superior volumes, pricing power and acceptance in the energy transition, as explained on pages 17-19.
Leading projects are profiled on page 20, which aim to combine blue hydrogen with CCS.
Leading companies in auto-thermal reforming (ATR) are profiled on page 21, based on reviewing technical papers and over 750 patents.
Aker Carbon Capture’s technology is profiled on page 22. Patents reveal a technical breakthrough, but it will only benefit indirectly from our blue hydrogen theme.
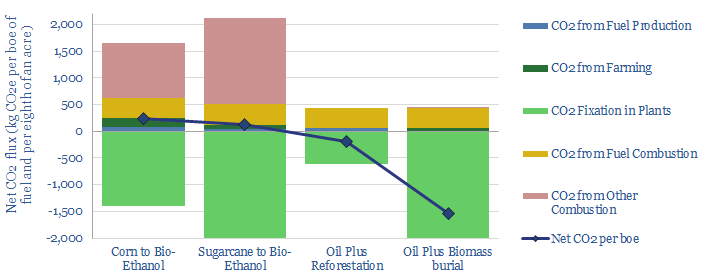
Burying biomass to sequester CO2 could be more economical than biofuel production with a $15-50/ton carbon price. Thus the global bioethanol industry could be disrupted. Burying biomass would also remove 8x more CO2 per acre, at a lower total cost. More conventional oil could be decarbonized with offsets. Ethanol mills and blenders would be displaced. The numbers and implications are outlined in this 12-page report.
Nature-based solutions to climate change need to double annual CO2 uptake from plants in our models of decarbonization, using forests and fast-growing grasses (pages 2-3).
We profile the bioethanol industry, which is already using fast-growing grasses to offset 2Mbpd of liquid fuels. But our models suggest the economics, efficiency and CO2 intensities are weak (pages 4-6).
A first alternative is to reforest the land used to grow biofuels, which would carbon-offset 1.5x more oil-equivalents than producing biofuels (pages 7-8).
A more novel alternative is to bury the biomass, such as sugarcane or other fast-growing grasses, which could sequester 8x more CO2, with superior economics at $15-50/ton CO2 prices (pages 9-11). Another concept is to bury wood for carbon sequestration.
Company implications are summarized, suggesting how the ethanol industry might be displaced, and quantifying the CO2 intensity of incumbents (page 12).
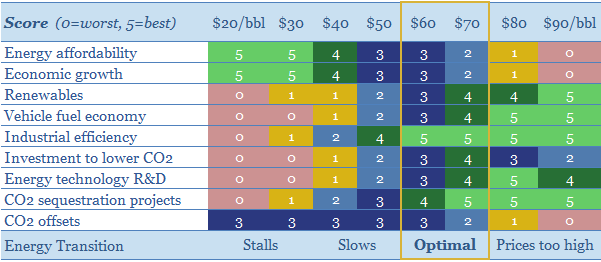
It is possible to decarbonize all of global energy by 2050. But $30/bbl oil prices would stall this energy transition, killing the relative economics of electric vehicles, renewables, industrial efficiency, flaring reductions, CO2 sequestration and new energy R&D. This 15-page note looks line by line through our models of oil industry decarbonization. We find stable, $60/bbl oil is the best oil price for energy transition.
Our roadmap for the energy transition is outlined on pages 2-4, obviating 45Mbpd of long-term oil demand by 2050, looking across each component of the oil market.
Vehicle fuel economy stalls when oil prices are below $30/bbl, amplifying purchases of inefficient trucks and making EV purchases deeply uneconomical (pages 5-6).
Industrial efficiency stalls when oil prices are below $30/bbl, as oil outcompetes renewables and more efficient heating technologies (page 7).
Cleaning up oil and gas is harder at low oil prices, cutting funding for flaring reduction, methane mitigation, digitization initiatives and power from shore (pages 8-9).
New energy technologies are developed more slowly when fossil fuel prices are depressed, based on R&D budgets, patent filings and venturing data (pages 10-11).
CO2 sequestrationis one of the largest challenges in our energy transition models. CO2-EOR is promising, but the economics do not work below $40/bbl oil prices (pages 12-14).
Our conclusion is that policymakers should exclude high-carbon barrels from the oil market to avoid persistent, depressed oil prices, and stabilize oil at the ‘best oil price for energy transition’ (as outlined on page 15).
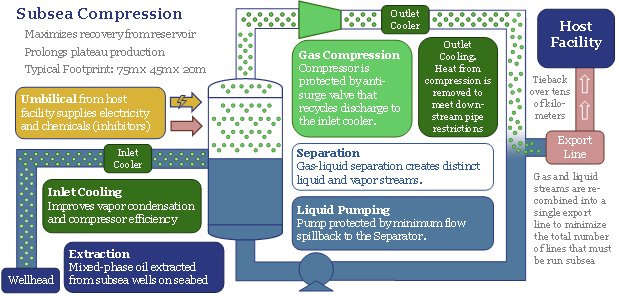
Offshore developments will change dramatically in the 2020s, eliminating new production platforms in favour of fully subsea solutions. The opportunity can increase a typical project’s NPV by 50%, reduce its breakeven by one-third and effectively eliminate upstream CO2 emissions. We have reviewed 1,850 patents to find the best-placed operators and service providers, versus others that will be disrupted. Overall, the theme supports the ascent of low-carbon natural gas, which should treble in the energy mix by 2050. This 22-page note presents the opportunity.
The offshore oil and gas industry’s progress towards ‘fully subsea’ developments, without any platforms or surface infrastructure being necessary, is reviewed in detail in pages 2-5, covering key projects and milestones from 1985-2000.
30% economic savings in both capex and opex are quantified line-by-line, across c50 cost lines, in pages 6-9.
1.5x NPV uplifts and 4pp IRR uplifts are quantified by modelling a representative fully greenfield gas-condensate project on pages 11-12.
CO2 emissions can be virtually eliminated by a fully subsea development solution. Pages 12-13 add up the impacts of higher efficiency, power from shore, fewer materials and the elimination of PSV/helicopter trips.
The key engineering challenges for fully subsea systems, which remain to be resolved, are summarized on page 14.
Who benefits from the trend toward fully subsea systems, is described from page 15 onwards after reviewing 1,850 patents around the industry. This includes both the leading service companies and operators (primarily Equinor, but also TOTAL, Shell).
The leaders in subsea compression technology are assessed on pages 16-17.
The leaders in subsea power systems are described on pages 18-19.
The leaders in next-generation subsea robotics are assessed on pages 20-21.
Others are disrupted, as is described in detail in page 22.
Covered service companies in the report include ABB, Aker, Eelume, GE, Kraken, Oceaneering, OneSubsea, Saipem, Siemens, Technip-FMC, Wood Group, the PSV and helicopter sector, and c20 early stage companies in next-generating subsea robotics.
We presented our ‘Top Ten Themes for Energy in the 2020s’ to an audience at Yale SOM, in February-2020. The audio recording is available below. The slides are available to TSE clients, in order to follow along with the presentation.
Please sign up to our distribution list, to receive our best ideas going forwards…
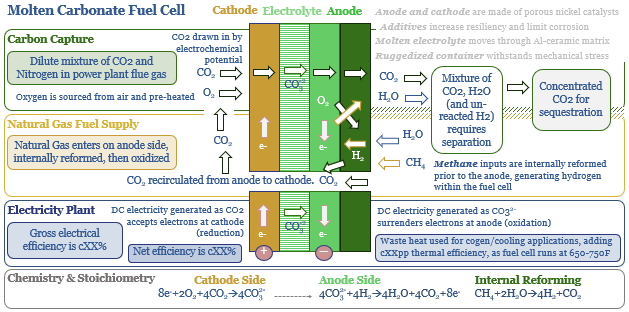
Molten carbonate fuel cells (MCFCs) could be a game-changer for CCS and fossil fuels. They are electrochemical reactors with the unique capability to capture CO2 from the exhaust pipes of combustion facilities; while at the same time, efficiently generating electricity from natural gas. The first pilot plant was due to be tested in 1Q20, by ExxonMobil and FuelCell Energy, but was deferred. Economics range from passable to phenomenal. The opportunity is outlined in our 27-page report.
Pages 2-4 outline the market opportunity for more efficient carbon separation technologies, which can be retrofitted to 4TW of pre-existing power plants, without adding $50/T of cost and 15-30% of energy penalties per traditional CCS.
Pages 5-13 outline how MCFCs work, including their operation, development history, how recent patents promise to overcome reliability problems, and their emergent adaptation to carbon capture.
Pages 14-18 assess the economics, both in absolute terms, and by comparison to new gas plants and hydrogen fuel cells. CCS-MCFC economics range from passable to phenomenal, at recent power prices.
Pages 19-23 suggest who might benefit. Fuel Cell Energy has received $60M investment from ExxonMobil, hence both companies’ prospects are explored.
Appendix I is an overview of incumbent CCS technologies, and their limitations.
Appendix II is an overview of six different fuel cell types, comparing and contrasting MCFCs.
Scaling up natural gas is among the largest decarbonisation opportunities on the planet. But this requires minimising methane leaks. Exciting new technologies are emerging. This 30-page note ranks producers, positions for new policies and advocates developing more LNG. To seize the opportunity, we also identify c25 early-stage companies and 10 public companies in methane mitigation. Global gas demand should treble by 2050 and will not be derailed by methane leaks.
This overview note was first published in 2019, then updated in Feb-2021 and September-2022, to add further case studies, companies and market updates. It contains all our latest views on methane mitigation, in a single, comprehensive resource.
Pages 2-5 explain why methane matters for climate and for the scale up of natural gas. If 3.5% of methane is leaked, then natural gas is, debatably, no greener than coal.
Pages 6-9 quantify methane emissions and leaks across the global gas industry, including a granular breakdown of the US supply-chain, based on asset-by-asset data.
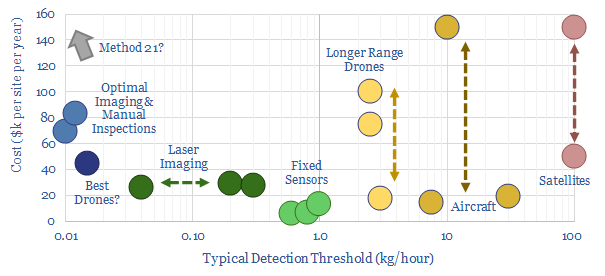
Page 10-11 outlines the incumbent methods for mitigating methane, plus our screen of 34 companies which have filed 150 recent patents for improved technologies.
Pages 12-13 outline the opportunity for next-generation methane sensors, using LiDAR and laser spectroscopy, including trial results and exciting companies.
Pages 14-15 outline the opportunity for next methane sensors, using AI and other ambient data, with a case study that likely offers detection costs below $10/ton CO2e.
Pages 16-18 cover the best new developments in drones and robotics for detecting methane emissions at small scale, including three particularly exciting companies.
Pages 19-20 outline next generation satellite technologies, which will provide a step-change in pinpointing global methane leaks and repairing them more quickly.
Pages 21-27 cover the changes underway in the oilfield supply chain, to prevent fugitive methane emissions, highlighting interesting companies and innovations.
Page 28-29 screens methane emissions across the different Energy Majors, and resultant CO2-intensities for different gas plays.
Page 30 advocates new LNG developments, particularly small-scale LNG, which may provide an effective, market-based framework to mitigate most methane.
Our underlying data-files into methane mitigation are also available to be viewed individually, in chronological order, covering company screens, technology reviews and leakage rate data.
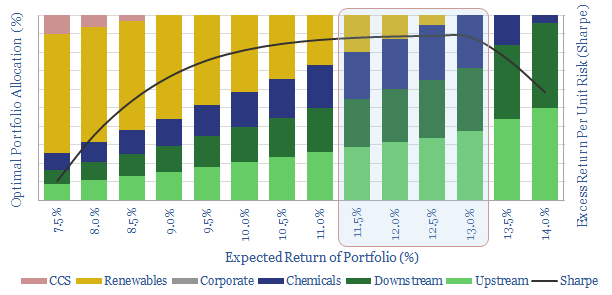
It is often said that Oil Majors should become Energy Majors by transitioning to renewables. But what is the best balance based on portfolio theory? Our 7-page note answers this question, by constructing a mean-variance optimisation model. We find a c0-20% weighting to renewables maximises risk-adjusted returns. The best balance is 5-13%. But beyond a c35% allocation, both returns and risk-adjusted returns decline rapidly.
Pages 2-3 outline our methodology for assessing the optimal risk-adjusted returns of a Major energy company’s portfolio, including the risk, return and correlations of traditional investment options: upstream, downstream and chemicals.
Page 4 quantifies the lower returns that are likely to be achieved on renewable investment options, such as wind, solar and CCS, based on our recent modeling.
Pages 5-6 present an “efficient frontier” of portfolio allocations, balanced between traditional investment options and renewables, with different risk and return profiles.
Pages 6-7 draw conclusions about the optimal portfolios, showing how to maximise returns, minimise risk and maximise risk-adjusted returns (Sharpe ratio).
The work suggests oil companies should primarily remain oil companies, working hard to improve the efficiency and lower the CO2-intensities of their base businesses.
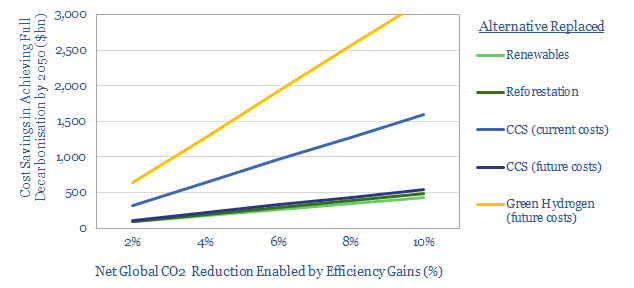
We argue CO2-labelling is the most important policy-measure that can be taken to accelerate the energy transition: making products’ CO2-intensities visible, so they can sway purchasing decisions. There is precedent to expect 4-8% savings across global energy use, which will lower the net global costs of decarbonisation by $200-400bn pa. Digital technologies also support wider eco-labelling compared with the past. Leading companies are preparing their businesses.
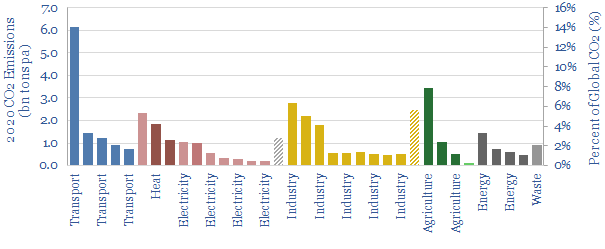
Faster Efficiency gains are critical to decarbonisation. We model it is possible to fully decarbonise the world’s energy system by 2050: c17% by ramping renewables, 26% by shifting to less CO2-intensive fossil fuels (which still grow in absolute terms to 2050), 27% through carbon capture initiatives and 30% through industrial efficiency gains and demand-side technologies, which get “more for less” (chart below). To repeat, the largest contributor to eliminating 2050’s CO2 is using energy more efficiently.
A problem: consumers currently have almost no idea whether they are consuming energy efficiently when making purchasing decisions. particularly in the food industry, which can comprise up to 30% of an individual’s carbon footprint, at 2.5T of CO2e pp pa (chart below, data here). One recent study in Nature found that 1000 consumers under-estimated the CO2 emissions of their dietary items by as much as 10x [1]. 59% of consumers confess being confused which foods count as sustainable.
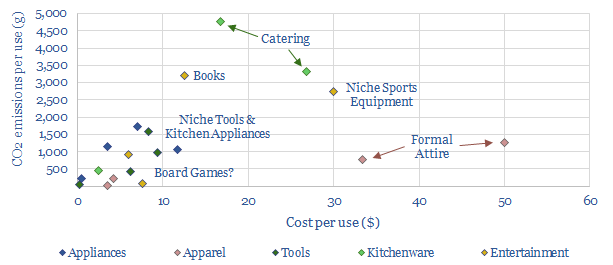
A few examples show how helpless we are at fore-knowing the carbon footprints of our purchases: How much more CO2 is there in 1kg of beef versus 1kg of vegetables? (the answer is a stark 13.5x, at 27kg vs 2kg). How about 1kg of cheese vs 1kg of milk (answer: 13.5kg vs 1.9kg). How about a typical book versus a typical tennis racquet? (answer: 6kg vs 3kg, chart below, data here). How about a “high CO2” versus a “low CO2” chocolate bar (6.5kg vs 0kg, as CO2-impact can vary 50x, within producers of the same product [2]). Is more CO2 saved by driving an electric car for a whole year or by forgoing a single Trans-Atlantic round-trip flight? (answer: both are around 2-3 tons). Are there any CO2-negative products for purchase? (there are, data here).
CO2 labelling must be a solution. If consumers are to favour lower carbon products, then knowledge is the first step. It is necessary to be able to compare and contrast products. This is “eco-labelling”: placing a label for the CO2 associated with each purchasing option. Ideally it is a numerical calculation, or more simply, a traffic-light (red, yellow, green) may be adopted.
Eco-Labelling in Practice: A Short History?
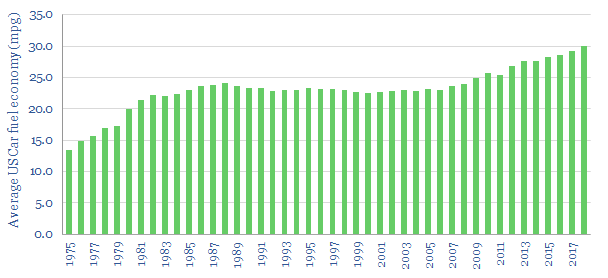
A precedent. CAFE standards for cars are the best-known, longest-running eco-labelling program. They go back to the 1973-4 oil crisis. Today, OEMs are required to use EPA-certified fuel economy test results and cannot advertise any other fuel economy metric for vehicles. Making fuel efficiency visible to consumers has been one driver behind the impressive 2% pa CAGR in US fuel economy (chart below).
Likewise, EU Ecolabels were established in 1992, to identify environmentally friendly products: at this time, 75% of fridges and freezers were rated as low efficiency (ratings D-G) while today, 98% are classed as highly efficient (ratings A++ or A+++), cutting their emissions by c7%. The label informs 85% of consumers’ purchasing decisions. What gets inspected by consumers is thus respected by suppliers.
Prior eco-labelling schemes have been attempted for broader consumer products, but the technology may not have been ready. The first supermarket carbon labelling program was implemented by Carbon Trust, in the UK, in 2006. It included Walkers Crisps, British Sugar and Quaker Oats. Tesco trialled carbon labels on milk, detergents, oranges and toilet paper in 2007, but the pilot was shelved in 2012, due to unforeseen costs and lack of take-up. Subsequent schemes have been trialed in Canada, Japan, Korea, Thailand, Switzerland, France, Finland and the US.
Digital technologies can help, making it easier to add up the CO2 associated with each input, at each successive stage of the supply chain, to yield a final estimate at the point of consumption. This will produce more precise estimates than in the past, which are more auditable and less expensive to compute.
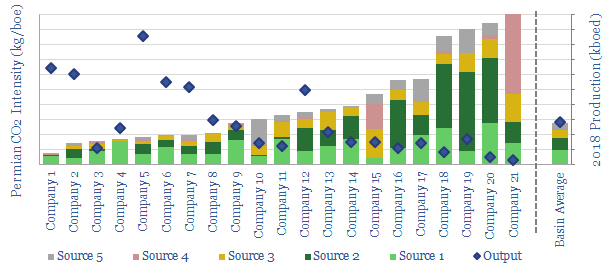
The US already has a toehold, through the EPA’s FLIGHT tool, which covers most industrial facilities and has a broad coverage. For example, it recently allowed us to decompose Permian producers’ total CO2-intensities (chart below, data here).
Technology companies are emerging to make further progress. As an example, Ecoingot is using a mobile phone-based scanner alongside app based on calculations, RFIDs and retailer data to make products’ CO2 visible to consumers. It is working with Whole Foods, Walgreens and CVS. Climate Neutral also launched in 2018, to help brands declare their intent to eliminate CO2 emissions in their products.
Policies could help further.
One past challenge has been that disclosures are voluntary, which means lagging
producers have no incentive to identify themselves. Policies for mandatory
eco-labelling may change this. For example, Denmark has announced climate
labelling on food products will accompany its plan to become carbon neutral by
2050: stickers will be placed on all food products to improve consumer choice. A
petition is currently gathering signatures in Germany, lobbying for a similar
requirement.
Consumers support it. A recent YouGov survey
of 9,000 consumers, across seven countries, found 67% support for recognisable
CO2 labelling on products. 66% of survey participants also say
they would feel more positive about companies that can demonstrate they are
making efforts to reduce carbon footprint of their products.
Companies support it. In December-2018, Carbon Trust estimated it was doing 40-50x more life-cycle CO2 analyses than a decade ago, particularly in the business-to-business category. Case studies on its website include BT, Carlsberg, Dyson, Evian, GSK, Howdens, Samsung, Vodafone et al. Pick one of these examples at random, and you learn that a Dyson Airblade hand-dryer is 80% more energy-efficient than the industry standard. It is not just in the oil industry that carbon credentials are set to impact capital costs.
What are the impacts on decarbonisation?
Impacts of Eco-Labelling? A Norwegian study has measured a 9% reduction in meat consumption, after adding traffic-light eco-labels in a University cafeteria [3]. Likewise, an Australian super-market found a 15% reduction in the sales of “black-labelled” goods and a 8% increase in green-labelled goods, after implementing its own pilot [4]. More ambitiously, Tesco and WWF have launched a campaign to cut the environment impact of the average UK shopping basket by 50%.
Costs of Decarbonisation could be lowered by c$200bn per annum in our base case scenario, where an c8% CO2 saving is achieved on 50% of products (chart below). Thus a lower reliance upon CCS or reforestation is required in our decarbonisation models. The savings could surpass $1trn per annum if the reliance is lowered on costly green hydrogen technologies, although these do not currently feature heavily in our decarbonisation models. Double the savings from eco-labelling, if the practice can drive a c8% efficiency gain through the entire energy system, and $400bn of annual savings are achieved.
We conclude one of the most critical policy challenges to drive the energy transition is to mandate broad CO2-labelling of products, so that consumers can begin selecting lower-CO2 items, where today’s visibility is woefully poor. In turn, this will reward companies that improve their emissions and disfavor those that do not. Decarbonisation will not be achieved by making the energy industry into a Waste Land, but by strengthening its efficiency.
References
[1] Camilleri, A., Larrick R. P., Hossain, S. & Patino-Echeverri, D. (2019). Consumers underestimate the emissions associated with food but are aided by labels. Nature.
[2] Poore, J. & Nemecek, T. (201). Reducing food’s environmental impacts through producers and Consumers. Science 360 (6392) 987-992,.
[3]
Slapo, H. B. & Karevold, K. I. (2019). Simple Eco-Labels to Nudge Customers
Toward the Most Environmentally Friendly Warm Dishes: An Empirical Study in a
Cafeteria Setting.
[4] Vanclay, J.K., J. Shortiss, S. Auselbrook, A.M. Gillespie, B.C. Howell, R. Johanni, M.J. Maher, K.M. Mitchell, M.D. Stewart, and J. Yates. 2011. Customer Response to Carbon Labelling of Groceries. Journal of Consumer Policy 34: 153–160.
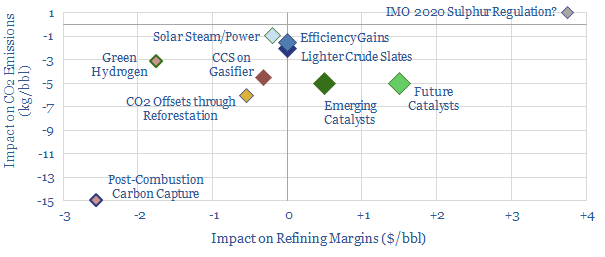
Refining has the highest carbon footprint in global energy. Next-generation catalysts are the best opportunity for improvement: uniquely, they could cut refineries’ CO2 by 15-30%, while also uplifting margins, which get obliterated by other decarbonisation approaches. Catalyst science is undergoing a digitally driven transformation. Hence this 25-page note outlines a new ESG opportunity around refining catalyst technologies. Industry leaders are also identified.
Pages 2-3 outline the need to decarbonise the refining industry, in order to clean up the world’s future oil production and preserve access to capital.
Pages 4-6 decompose the sources of CO2 emissions across a typical refinery, process-by-process; as a function of heat, utilities and hydrogen.
Page 7-8 outline small opportunities to improve refinery CO2 intensities, via continued process enhancements, changing crude slates and renewable energy.
Page 9 finds green hydrogen can reduce CO2 emissions by c7-15%, but economics are unfavorable, obliterating refining margins.
Pages 10-12 models the costs of post-combustion carbon capture, which could cut CO2 intensities by 25-90%, but also risks cutting margins by $2-4/bbl.
Pages 13-14 present the opportunity for better catalysts, identifying which Energy Majors have the leading refining technologies, based on patent filings.
Pages 15-17 outline the most promising, emerging catalyst technologies from 50 patents we studied. They can reduce refinery CO2 intensities by 5kg/bbl.
Pages 18-21 highlight breakthrough, digital technologies to improve the development of new catalysts, including super-computing and machine learning techniques.
Pages 23-24 screen 35 leading catalyst companies, including Super-Majors, chemicals companies and earlier-stage pure-plays.
Cookies?
This website uses necessary cookies. Our cookies are simply to improve your experience. We do not undertake any advertising or targeting via our cookies. By clicking 'accept' or continuing to use the website, you consent to our use of cookies.AcceptRead More
Privacy & Cookies Policy
Privacy Overview
This website uses cookies to improve your experience while you navigate through the website. Out of these, the cookies that are categorized as necessary are stored on your browser as they are essential for the working of basic functionalities of the website. We also use third-party cookies that help us analyze and understand how you use this website. These cookies will be stored in your browser only with your consent. You also have the option to opt-out of these cookies. But opting out of some of these cookies may affect your browsing experience.
Necessary cookies are absolutely essential for the website to function properly. This category only includes cookies that ensures basic functionalities and security features of the website. These cookies do not store any personal information.
Any cookies that may not be particularly necessary for the website to function and is used specifically to collect user personal data via analytics, ads, other embedded contents are termed as non-necessary cookies. It is mandatory to procure user consent prior to running these cookies on your website.