Energy transition: the fantasy of the perfect?

Energy transition fantasy crisis

This 14-page note explores an alternative framework for energy transition: what if the fantasy of perfect energy consistently de-rails good pragmatic progress; then the world back-slides to high-carbon energy amidst crises? We need to explore this scenario, as it yields very different outcomes, winners and losers compared with our roadmap to net zero.


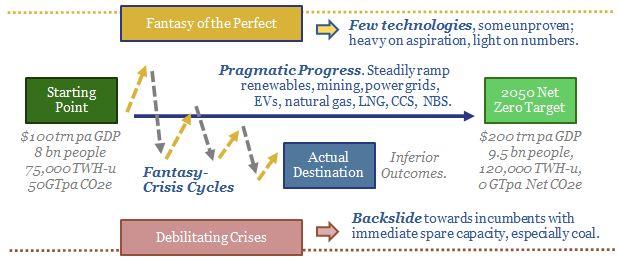
Energy transition fantasy crisis. New energies are amazing. But their future ramp-up creates uncertainties that will naturally deter investment. If future technologies are going to be close to perfect – low-cost, clean, abundant, practical – then why invest in anything less than perfect? The paradox is that under-investment in energy amplifies the risks of crises. And during a crisis, priorities shift. The goal is simply to end the crisis. Quickly. Even if it means backsliding towards higher-carbon energy. This is what we call a ‘fantasy crisis cycle’. The logic of this framework is explained on pages 2-3.

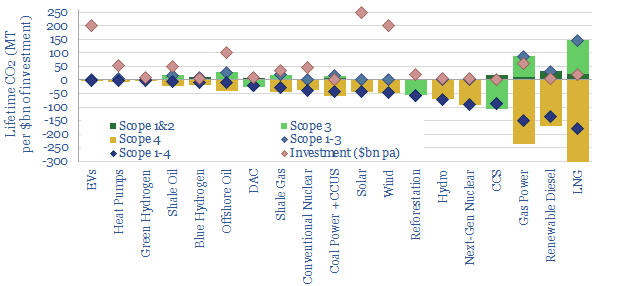
Pragmatism unravelled? Real world projects and technologies are almost always less than perfect. Thus they will tend to get overlooked when perfection is the standard. And they take a long time to construct, which means that they cannot help resolve crises. Thus we think that energy transition fantasy crisis cycles are going to lead to lower deployment of most of the pragmatic investments needed in our roadmap to net zero. Seven main categories and examples are noted on pages 4-5.

How to avoid energy transition fantasies? The thing about perfection is that it is easy to imagine and difficult to deliver. We suggest some criteria to identify fantasy thinking, and risk future technologies appropriately, on pages 6-7.

Any port in a storm? If we do not invest enough in energy and materials, then we will have shortages of energy and materials, and the most likely result is a series of crises. Crises and their implications are discussed on pages 8-9.

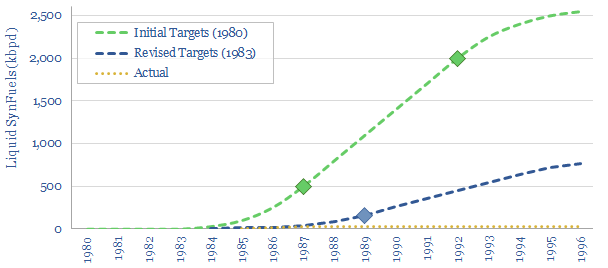
Fantasy crisis cycles. Case studies are presented of prior fantasy crisis cycles in energy industry history, going back to the 1950s, and running through to the present day, on pages 10-11.

Winners and losers? Nobody fares well in a crisis, in absolute terms. But some industries fare materially better in relative terms, especially relative to expectations during the fantasy phase, and relative to our usual roadmap to net zero. The outlook for large companies, large incumbents, especially coal producers, gets discussed on pages 12-14.

Energy policy: unleashing new technologies?

Does policy de-risk new technology?

Does policy de-risk new technology? This 10-page note is a case study. The Synthetic Fuels Corporation was created by the US Government in 1980. It was promised $88bn. But it missed its target to unleash 2Mbpd of next-generation fuels by 1992. There were four challenges. Are they worth remembering in new energies today?


The Synthetic Fuels Corporation was created by the US Government in 1980. To great fanfare. Its goal was unleashing synfuels. At $325bn in today’s money, its budget was actually quite similar to the energy-climate portion of 2022’s Inflation Reduction Act.

We explore other similarities between energy policies in the 1980s, the creation of the SFC, and emerging policies in the energy transition (pages 2-4). Our conclusion is that the similarities are surprisingly striking.

The main production pathway that was envisaged in the creation of synfuels started with coal, produced hydrogen as an intermediate, and then converted syngas into liquid fuels. The process is described in more detail on page 5.

Costs are a challenge. We have modelled the energy costs of synfuels, in today’s money, using models of coal gasification and gas-to-liquids. Ultimate costs of synfuels — in $/bbl and c/kWh-th — are derived on page 6.

Efficiency is a challenge. We modelled the thermodynamics and energy penalties of producing synfuels, in a helpful waterfall chart schematic on page 11. You cannot get around the second law of thermodynamics.

Other technical challenges are discussed on page 8. Some projects backed by the SFC simply did not work. Others were very small scale (around 5kbpd).

Politics could be described as the biggest barrier. Policies have an annoying habit of changing. The downfall of the US’s political push towards synfuels, which played out throughout the 1980s, is summarized on page 9.

Does policy de-risk new technology? We draw out conclusions for the energy transition on page 10. We all clearly want to avoid repeating mistakes of the 1980s. So our goal is to offer constructive suggestions for decision-makers, investors and project developers.

Solar volatility: tell me lies, tell me sweet little lies?

short-term volatility of solar

This 20-page note quantifies the statistical distribution of the short-term volatility of solar power plants, by evaluating second-by-second data, for an entire year. Solar output typically flickers downwards by over 10%, around 100 times per day. We want to ramp solar in the energy transition. But how can industrial processes truly be ‘powered by solar’? Buffering the volatility creates opportunities for gas and nuclear back-ups, inter-connectors, supercapacitors, smart energy and power electronics?


Fleetwood Mac released their classic hit, ‘Little Lies’, in the winter of 1987. In the song, Christine McVie describes a once-wonderful relationship that has ultimately run its course. There is a reluctance to accept this fact about the future. Hence the song’s chorus pleads “tell me lies, tell me sweet little lies”. The refrain is then hauntingly echoed by Stevie Nicks and Lindsey Buckingham (“tell me, tell me lies!”).

This research note is a statistical analysis of an entire year’s second-by-second solar volatility (our methodology is laid out on pages 2-5). It is a nerdy and numerical topic. Hence without wishing to dilute the importance of this issue, we are going to draw some inspiration from Fleetwood Mac in our chapter headings.

For example, should solar power keep ramping up forever, to over 50% of future power grids? Or might solar slow down, after running its course, and ramping to 20-30%? And are analysts like us, who want to see solar capacity additions ramp up by 3-5x in the energy transition, wilfully asking to be told sweet little lies about overcoming short-term volatility issues? Our goal is to use data and find genuine, objective answers to these questions.

Variability. The best day, a typical day and the worst day of second-by-second solar volatility are presented on pages 6-9. For example, the chart above shows the second-by-second solar output at a typical-good day, with relatively little short-term volatility.

The statistical distribution of different days’ solar volatility is plotted in candlestick charts and marimekko charts on pages 10-11. There is volatility in the volatility itself.

“Powered by solar”. Can we power typical industrial processes purely from input feeds like the ones we have shown in our chart above, and throughout this report? Issues that need to be overcome are discussed on pages 12-15. They include annoyingness, lost output, mission-critical loads, damaged work-in-progress and faster degradation rates at industrial machinery.

Overcoming volatility. We want to ramp solar as much as possible as part of our ‘roadmap to net zero‘. We think a future grid with 20-30% solar are optimal, which involves a 3-5x acceleration in the pace of annual solar deployments. However, smoothing the short-term volatility, we think, is also going to create concomitant opportunities (page 16).

The best opportunities to de-bottleneck short-term solar volatility include diversified and resilient power grids, gas and nuclear back-ups, super-capacitors, inter-connectors, smart-energy, demand shifting and power electronics. The merits, drawbacks and costs (in $/kW) of these different solutions are presented on pages 17-20.

This note into the short-term volatility of solar (i.e., second-by-second) aims to complement our other research into the long-term volatility of solar (i.e., year-by-year). It is interesting that building out power grids and inter-connectors helps to resolve both issues.

Scope 4 emissions: avoided CO2 has value?

Scope 4 CO2 emissions

Scope 4 CO2 emissions reflect the CO2 avoided by an activity. This 11-page note argues the metric warrants more attention. It yields an ‘all of the above’ approach to energy transition, shows where each investment dollar achieves most decarbonization and maximizes the impact of renewables.


Scope 1-3 CO2 emissions are now familiar to most decision-makers. Scope 1 captures the CO2 emitted directly in creating a product. Scope 2 adds the CO2 emitted in generating electricity used to create the product. And Scope 3 adds the CO2 emitted in using the product, for example, by combusting it. A summary is presented by fuel and by material on pages 2-3, with the implication that ‘everything is bad, only some things are less bad than others’.

Scope 4 CO2 is intended as an antidote to the depressed conclusion that ‘everything is bad’. It considers the CO2 avoided by an activity. Working from home avoids the CO2 of a commute. Building a wind farm may displace CO2-intensive coal. So too might developing a gas field. Thus the purpose of this note is to construct Scope 1-4 CO2 calculations for 20 different energy technologies, fairly, objectively, and then draw conclusions. The numbers are remarkable (page 4).

‘All of the above’. Every single option in our chart above has net negative Scope 1-4 CO2 emissions. The more investment that flows in to all of these categories, the faster the world will decarbonize. Our overall roadmap to net zero needs to treble global energy capex to over $3trn pa (pages 4-8).

Project developers and investors should consider Scope 4 CO2. Many categories with deeply negative Scope 1-4 CO2 emissions — sometimes achieving 3x more net CO2 abatement per $1bn of investment than wind, solar and EVs — have been unsuccessful in attractive capital. It may therefore be appealing for project-developers to present Scope 1-4 CO2 benefits on a clear and transparent basis. It may also be appealing for investors to communicate the Scope 1-4 CO2 of their portfolios to their own stakeholders (page 9).

Maximizing decarbonization. Scope 4 CO2 emissions depend on counterfactuals. What is an activity displacing? This matters across the board and can also promote faster decarbonization. For example, a new wind project that displaces nuclear achieves no net decarbonization, whereas an inter-connector that allows that same wind project to displace coal-power avoids 1.2 kg/kWh of CO2 (page 10).

Conceptual limitations of Scope 4 CO2 are discussed on page 11. However, we conclude it is an increasingly important metric for decision makers in the energy transition, to ensure adequate energy supplies are developed, while also decarbonizing as fast as possible.

Savanna carbon: great plains?

Savanna Carbon

Savanna carbon is stored in an open mix of trees, brush and grasses. Savannas comprise up to 20% of the world’s land, 30% of its annual CO2 fixation, and we estimate their active management could abate 1GTpa of CO2 at low cost. This 17-page research note was inspired by exploring some wild savannas and thus draws on photos, observation, anecdotes, technical papers.


Savannas landscapes are summarized on pages 2-4, following some on-the-ground exploration of these landscapes near Kruger National Park in 2022, which made us take a deeper interest in savanna carbon.

As a result, we are re-thinking three conclusions about nature and climate, as part of our roadmap to net zero:

(1) Conservation is as important as reforestation and should not be dismissed. Once slow-growing trees and endangered species are lost, they are not coming back (pages 5-7).

(2) Optimization of CO2 is particularly nuanced in savanna landscapes and must be balanced with other environment goals, especially biodiversity (pages 8-11). This is especially true for fire suppression (pages 12-14). Learning curves are crucial (pages 11, 15).

(3) Re-wilding pasturelands into savannas may absorb 50–100 tons of CO2 per acre. This is less than forests. But it may be more achievable in certain climates. And where it attracts tourist revenues, CO2 abatement costs may actually be sub-zero (pages 14-16).

Our conclusions and CO2 quantifications of savanna carbon are summarized on page 17.

Underlying data into the CO2 absorption of tree species and savanna landscapes is tabulated here. As an approximate breakdown, 33% of the CO2 is stored in soils, 33% in living woody tissue, and the remainder is distributed across roots, dead wood, shrubs and litter.

Energy shortages: priced out of the world?

Energy shortages in low income countries

Deepening energy shortages in 2022-30 could devastate low-income countries, geopolitically isolate the West, and de-rail decarbonization. This 13-page note evaluates the linkage between energy consumption and income over the past half century and quantifies what a ‘just transition’ would look like.


The reason for this research note on is that we see energy shortages deepening throughout the 2020s. This suggests someone will need to curtail energy use. What is the answer is low-income consumers in low-income countries? (pages 2-3).

Key trends from 50-years of global economic development are drawn out on pages 4-6, after tabulating 60,000 data-points, across 25 key countries and regions. The depressing conclusion is around 10x ‘energy inequality’ between the top 1bn and the bottom 4bn.

Our analysis on energy shortages in low income countries most likely under-states the degree of energy use inequality, for methodological reasons, discussed on page 7.

What is a ‘just transition’? Our answer is laid out on pages 8-9, finding a balance between economic development and energy usage.

Constructive options. The biggest bottleneck for a just ‘energy transition’, clearly, definitively, is a lack of energy investment, especially renewables and natural gas. Shortly followed by greater efficiency initiatives in the West (pages 10-11).

Our conclusions and questions over the future of world economic development amidst the energy transition are laid out on pages 12-13.

To read about some of our ideas on how to cure emerging energy shortages in the gas and power sectors, please see our article here.

Nuclear fusion: what are the challenges?

challenges of nuclear fusion

Nuclear fusion could provide a limitless supply of zero-carbon energy from the 2030s onwards. Thus 30 private companies have raised $4bn to progress new ideas. But the goal of this 20-page note is simply to understand the challenges of nuclear fusion, especially deuterium-tritium tokamaks. Innovations need to improve EROI, stability, longevity and ultimate costs.


The purpose of this note is to help decision-makers understand nuclear fusion, simply, in plain language, assuming that you are reasonably literate in science and economics, but do not have a pre-existing degree in nuclear physics.

Binding energies of atomic nuclei are a fundamental force shaping our universe. They explain why some atoms release energy as they fission, and some atoms release energy as they fuse. It is easy to quantify ‘how much energy’ using pages 2-3 of the report.

So is it a real and feasible energy source? We outline why it is on page 4. But what are the fourteen nuclear fusion challenges that a reactor will need to overcome?

Heating up a nuclear fusion fuel is covered on pages 4-7, covering possible fuel selections, the ‘Coulomb barrier’ for achieving fusion, and heating methods that can surpass 100M C temperatures.

Confining a plasma is covered on pages 8-9, explaining how super-conducting magnets can levitate a stream of super-heated, charged particles. Or not.

Ignition of plasma. What happens to the reaction products? How do you harness the heat? Without the reactor melting? Without other safety issues? We answer these questions on pages 10-12.

Practical considerations for running a fusion reactor are: How do you source, purify and inject fuels to the reactor? What energy gain factor is needed? What maintenance requirements and costs? How flexible will the reactor be? Can reactors be down-sized? We answer these questions on pages 13-17.

Economic considerations. Limitless energy does not necessarily mean cheap energy. At the moment, we think fusion could reach commerciality in the 2030s, but it will ‘split the global CO2 abatement cost curve’ into two. Effectively there would be no need for abatement options costing more than $200-300/ton and create an effective ‘cap’ on all future energy prices.

Our patent review of Commonwealth Fusion, a private fusion company that raised $1.8bn in Series B funding, is linked here.

Decarbonizing global energy: the route to net zero?

Decarbonizing global energy

This 18-page report revises our roadmap for the world to reach ‘net zero’ by 2050. The average cost is still $40/ton of CO2, with an upper bound of $120/ton, but this masks material mix-shifts. New opportunities are largest in efficiency gains, under-supplied commodities, power-electronics, conventional CCUS and nature-based CO2 removals.

Important note: our latest roadmap to net zero is from 2022, published here. But this note remains on our website, for transparency into our views at the end of 2021.


This note looks back across 750 of our research publications from 2019-21 and updates our most practical, lowest cost roadmap for the world to reach ‘net zero’. Our framework for decarbonizing 80GTpa of potential emissions in 2050 is outlined on pages 2-3.

Our updated roadmap is presented on pages 4-6. Most striking is the mix-shift. New technologies have been added at the bottom of the cost curve. Other crucial components have re-inflated. And we have also been able to tighten the ‘risking factors’ on earlier-stage technologies, thus an amazing 87% of our roadmap is not technically ready.

The resulting energy mix and costs for the global economy are spelled out on pages 7-8, including changes to our long-term forecasts for oil, gas, renewables and nuclear.

What has changed from our 2020 roadmap? A full attribution is given on pages 9-10. Disappointingly, global emissions will be 2GTpa higher than we had hoped mid-decade, as gas shortages perpetuate the use of coal.

A more detailed review of our roadmap is presented on pages 11-18. We focus on summarizing the key changes in our outlook in 2021, in a simple 1-2 page format: looking across renewables, nuclear, gas shortages, inflationary feedback loops, more efficiency gains, carbon capture and storage and nature-based carbon removals.

Green steel: circular reference?

green steel

Steel explains almost c10% of global CO2. Hence 2021 has seen the world’s first ‘green steel’ made using green hydrogen. Yet inflation worries us. At $7.5/kg H2, green steel would cost 2x conventional steel. In turn, doubling the global steel price would re-inflate green H2 costs by $0.5/kg. This 16-page note explores inflationary feedback loops and other options for steel-makers.


Global steel production runs at 2GTpa, comprising one of the ‘top ten’ materials made by mankind. 70% of production is from blast furnaces and basic oxygen furnaces emitting 2.4 tons of CO2 per ton of steel output. Pages 2-4 provide an overview of the industry, its production processes and their CO2 emissions.

Green hydrogen is generating excitement as an abatement option. We review pilot projects and optimistic projections from technical papers on pages 5-6.

What about the costs? We have modeled the economics of a full-scale switch to green hydrogen in a Direct Reduced Iron + Electric Arc Furnace plant configuration. We would see costs doubling, but c85-90% of the CO2 can be removed (page 7).

Inflationary feedback loops have been a recurring topic in our recent research, and steel makes an interesting case study. Steel is used in wind, solar, power distribution, batteries, hydrogen electrolysers and hydrogen storage infrastructure. So what happens to the price of green hydrogen if all of these value chain components switch to 2x more expensive green steel? We run through the results on pages 8-11, then discuss how these inflationary feedback loops might actually play on pages 12-13.

Technical challenges for the adoption of green hydrogen in the steel industry are discussed on page 14. We are skeptical of the cost-deflation promised in other studies.

Our conclusions are that there may be some niche uses for green steel, but we prefer other options for mass-scale decarbonization of the steel industry, on pages 15-16.

Is the world investing enough in energy?

Global energy investment in 2020-21

Global energy investment in 2020-21 has been running 10% below the level needed on our roadmap to net zero. Under-investment is steepest for solar, wind and gas. Under-appreciated is that each $1 dis-invested from fossil fuels must be replaced with $25 in renewables, to add the same new energy supplies. Future energy capex requirements are staggering. These are the conclusion in our 14-page note.


This 14-page note compares annual energy investment in different upstream energy sources with the amounts that would be required on our roadmap to net zero. The methodology is explained on page 2.

Current investment levels in each energy source are described on pages 3-5, reviewing the trajectory for each major category: oil, gas, coal, wind and solar. A stark contrast is found in capex per MWH of new added energy supplies.

We have constructed 120 different models, in order to stress-test the capex costs per MWH of new added energy supplies, across different resource types. Conclusions and comparisons from our modelling are presented on pages 6-8.

How much would the world need to be investing, on our roadmap to net zero, or indeed on the IEA’s roadmap to net zero? We develop our numbers, category by category, on pages 9-12, to identify where the gaps are greatest.

Conclusions and controversies are laid out on pages 13-14. Disinvestment from oil and gas will tend to exacerbate future energy shortages. To avoid this, it would be ideal to replace each dis-invested $1 of oil and gas investment with around $25 of new renewables investment.

Copyright: Thunder Said Energy, 2019-2024.