Search results for: “volatility volatile”
-
Wind volatility: second by second output data?
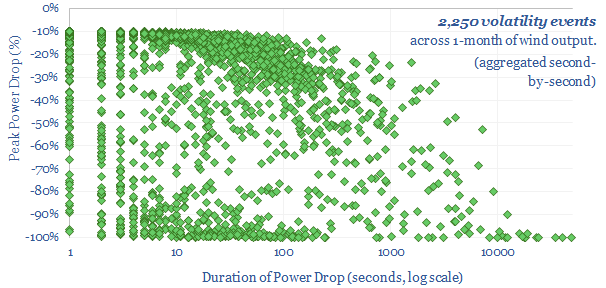
We have evaluated the second-by-second data on the power output of a 25MW onshore wind farm in Germany. A typical day sees 75 volatility events. Compared to solar, wind power drops slightly less frequently, but more extensively (often >90%) and for longer (often several hours or days). Both wind and solar show high short-term volatility.
-
UK grid volatility as renewables gain share?
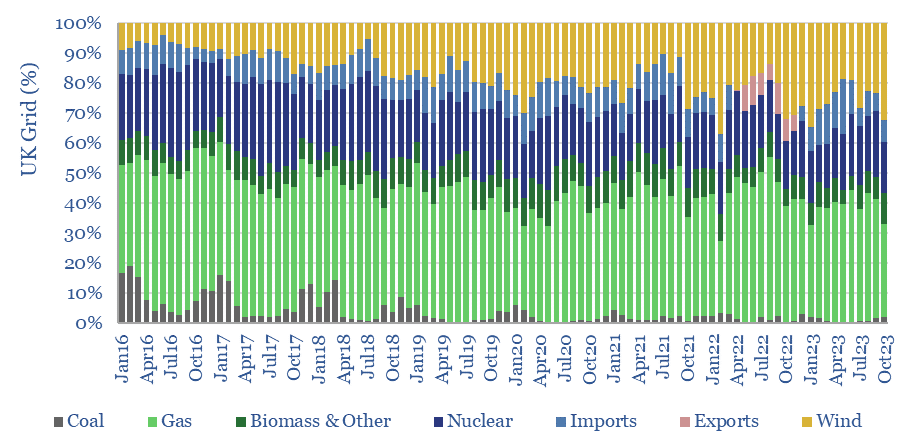
This data-file contains the output from some enormous data-pulls, evaluating UK grid power generation by source, its volatility, and the relationship to hourly traded power prices. We conclude the grid is growing more expensive and volatile, with the increasing share of wind.
-
Power transmission: inter-connectors smooth solar volatility?
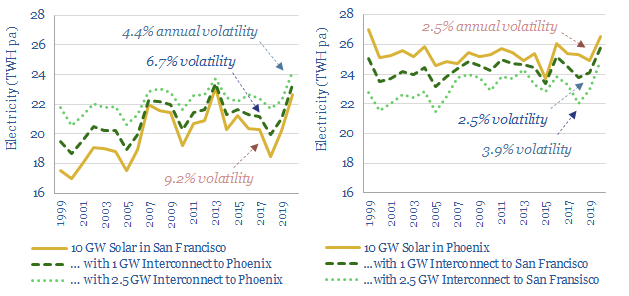
Can large-scale power transmission smooth renewables’ volatility? To answer this question, this horrible 18MB data-file aggregates 20-years of hour-by-hour solar insolation arriving at four cities in the US. The volatility in year-by-year can be halved by a single inter-connector.
-
Solar generation: minute by minute volatility?
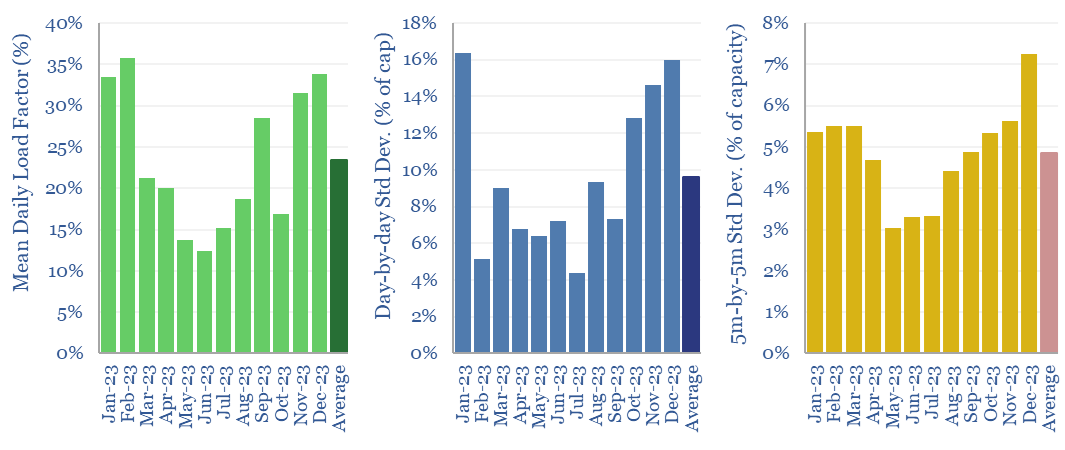
The volatility of solar generation is evaluated in this case study, by tracking the output from a 275MW solar project, at 5-minute intervals, throughout an entire calendar year. Output is -65% lower in winter than summer, varies +/-10% each day, and +/- 5% every 5-minutes, including steep power drops that in turn require back-ups.
-
Wind generation case study: minute by minute volatility?
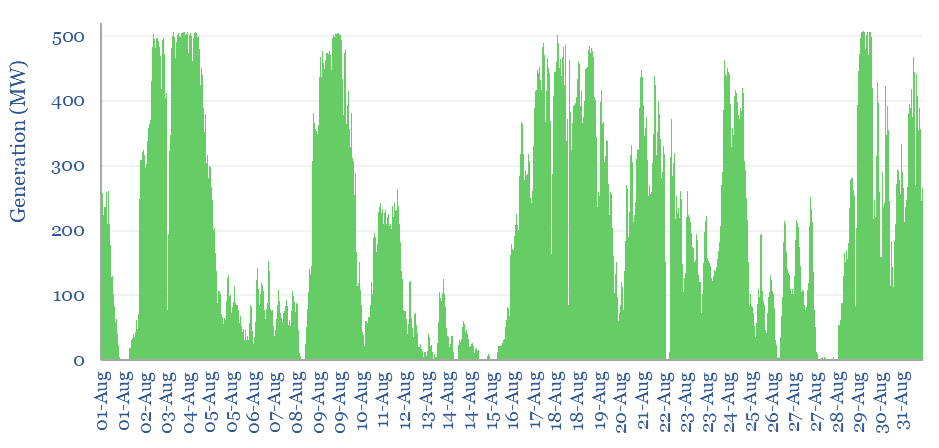
The volatility of wind generation is illustrated in this data-file, by aggregating the data for a large wind project in Australia, every five minutes, across an entire calendar year. Intra-day and inter-day volatility is 30-60% higher than for solar. 2-6 day feasts and famines are hard to backstop with batteries. Solar also cannibalizes wind?
-
Global power price volatility tracker?
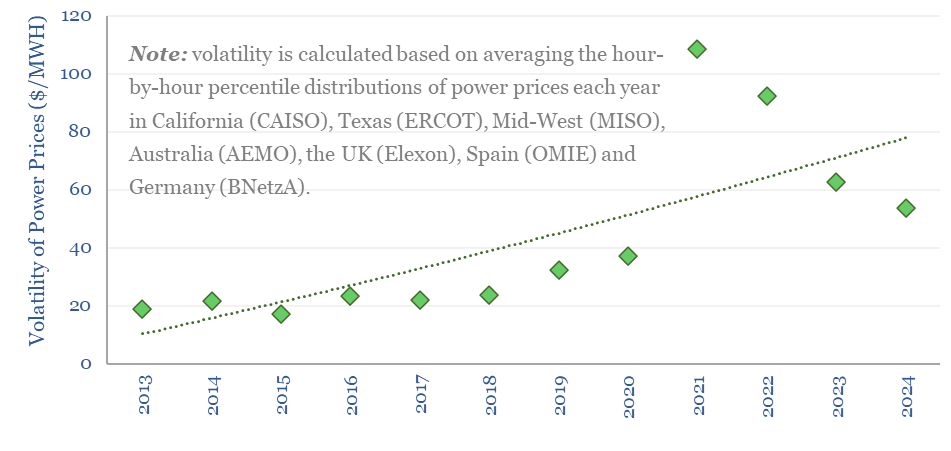
The volatility of power grids has doubled over the past decade from 2013-2024. This data-file tracks the percentile-by-percentile distributions of power prices, each year, in seven major grid regions (Texas, California, US MidWest, Australia, the UK, Germany, and Spain), as a way of tracking increases in global power price volatility. The growing volatility of power…
-
Solar volatility: second by second output data?
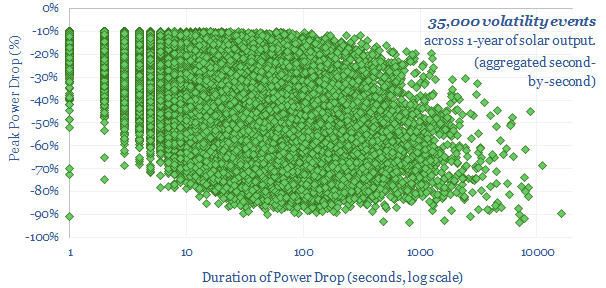
We have aggregated the volatility and power drops across an entire year of second-by-second solar data. Each day typically sees 100 volatility events where output drops by over 10%, and 10 events where output drops by over 70 events. Volatility also varies day by day.
-
Oil markets: rising volatility?
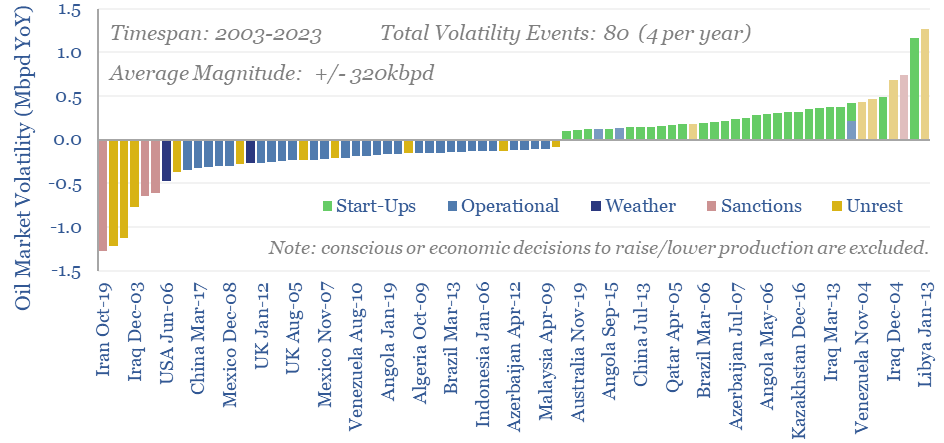
Oil markets endure 4 major volatility events per year, with a magnitude of +/- 320kbpd, on average. Their net impact detracts -100kbpd. OPEC and shale have historically buffered out the volatility, so annual oil output is 70% less volatile than renewables’ output. This 10-page note explores the numbers and the changes that lie ahead?
-
Demand shifting: electrical flexibility by industry?
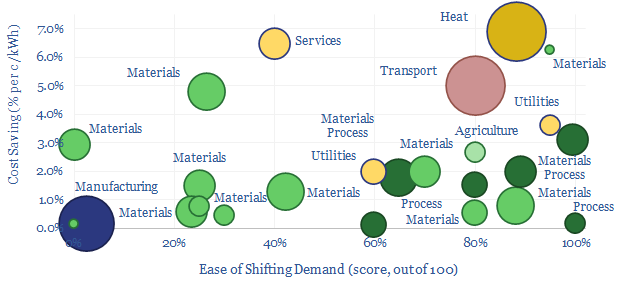
Demand shifting flexes electrical loads in a power grid, to smooth volatility and absorb more renewables. This database scores technical potential and economical potential of different electricity-consuming processes to shift demand, across materials, manufacturing, industrial heat, transportation, utilities, residential HVAC and commercial loads.
Content by Category
- Batteries (89)
- Biofuels (44)
- Carbon Intensity (49)
- CCS (63)
- CO2 Removals (9)
- Coal (38)
- Company Diligence (94)
- Data Models (838)
- Decarbonization (160)
- Demand (110)
- Digital (59)
- Downstream (44)
- Economic Model (204)
- Energy Efficiency (75)
- Hydrogen (63)
- Industry Data (279)
- LNG (48)
- Materials (82)
- Metals (80)
- Midstream (43)
- Natural Gas (148)
- Nature (76)
- Nuclear (23)
- Oil (164)
- Patents (38)
- Plastics (44)
- Power Grids (130)
- Renewables (149)
- Screen (117)
- Semiconductors (32)
- Shale (51)
- Solar (68)
- Supply-Demand (45)
- Vehicles (90)
- Wind (44)
- Written Research (354)
