It is no longer possible to compete in the US shale industry without leading digital technologies. This 10-page note outlines best practices, process by process, based on 500 patents and 650 technical papers. Chevron, Conoco and ExxonMobil lead our screens. We profile where they have an edge, to capture upside in the industryโs dislocation and recovery. Disconcertingly absent from the leader-board is EOG, whose long-revered technical edge may now have been eclipsed by others.
LNG: deep disruptions?
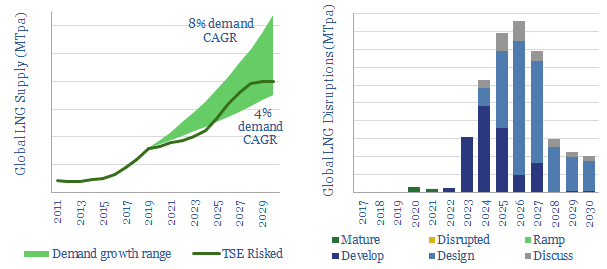
There is now a potential 100MTpa shortfall in 2024-26 LNG supplies: deeply negative for energy transition, but positive for LNG incumbents. The last oil industry crisis, in 2014-16, slowed down LNG project progress, setting the stage for 20-60MTpa of under-supply in 2021-23. The current COVID-crisis could cause a further 15-45MTpa of supply-disruptions, after looking line-by-line through our database of 120 projects, described in this 6-page note.
More dangerous than coronavirus? The safety case for digital and remote operations.
Remote working, digital de-manning, drones and robotics — all of these themes will structurally accelerate in the aftermath of the COVID crisis. Our research outlines their economics and how they can accelerate the energy transition. But this short note considers the safety consequences. They are as significant as COVID itself. And equally worthy of re-casting behaviours, policies and investments.
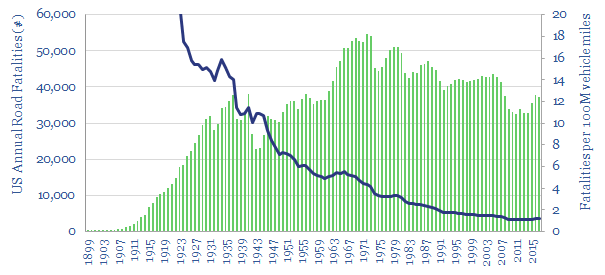
At the time of writing, the United States has been hardest hit by the COVID crisis out of any country in the world. It has incurred c35,000 fatalities. However, in the past five years, the US has also incurred an average of 35,000 fatalities on its roads each year (below). This is c100 deaths per day. 1 out of every 10,000 people is killed on US roads each year. There are 1.2 death for every 100M vehicle miles driven (and 3.2 trn miles are driven each year).
Likewise, at the time of writing, the US has been hit by 700,000 COVID cases. For comparison, there are 2.6M injuries on US roads each year, and 6.3M traffic accidents. This means 1 out of every 125 people is injured on US roads each year. There are 83 injuries for every 100M vehicle miles driven.
If you believe in working from home to save lives amidst the coronavirus crisis, a similar argument may justify working from home, where possible.
In addition, 5,250 US workers were killed in workplace fatalities in the most recent annual data, equivalent to 1 out of every c30,000 full-time employees. 40% of these deaths occur on roads. Of all the major job categories shown below, the most dangerous is trucking, where 1 out of every 4,000 full-time employees is killed each year.
Looking more granularly, COVID has so far killed 1 out of every 10,000 people in the United States. However, fatality rates range from 1 in 10,000 to 1 in 1,000 for workers in some of the more physically intensive industries (as shown below), which comprise 10% of all the hours worked around the US economy.
Workplace injury rates are 3% across the entire US economy. This is also 10x higher than the number of documented COVID cases so far in the United States.
If you believe in using technology to save lives amidst the coronavirus crisis, a similar argument may justifying greater deployment of autonomous technologies, digital de-manning, drones and droids, across the broader US labor market.
Our research finds that 48% of recent digitization initiatives have materially improved safety (chart below). 60% also materially lowered costs, 55% materially increased output and 24% materially lowered CO2 emissions.
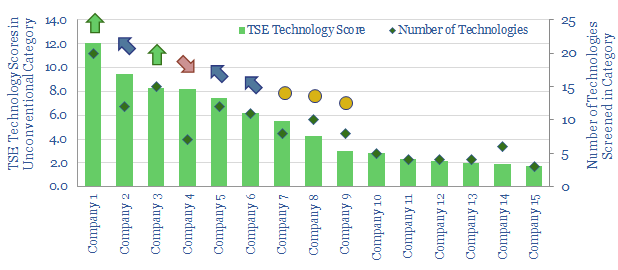
To recycle an example from the note, there is no need for a worker to be placed into harm’s way — climbing a scaffold to inspect a roof or lowered on a harness to inspect the undersides of an oil platform — as remote monitoring, drone and robotics technologies become available. This is why we have recently screened which operators are among the technology leaders, including in digital technologies (chart below).
The importance of remote work, digitization technologies and robotics may sound obvious when framed in the terms above. But they are not being deployed sufficiently. The chart below shows the number of road fatalities in the US, declining at a 3.4% CAGR since 1920. But there has been no progress in the past ten years since 2009. The absolute count of road fatalities in the latest data is no better than in 1960 (below).
Likewise, workplace fatality rates deflated at 3% pa since 1992, but they have also since stalled. No net improvement has occurred since 2009.
Safety matters, during the COVID-crisis, and after the COVID crisis. Remote and digital technologies can play an enormous role, if enabled by policies and embraced by forward-thinking companies. Please contact us if we can help you screen opportunities. And sorry for the morbid tone of this short note.
Turn the Plastic into Roads?
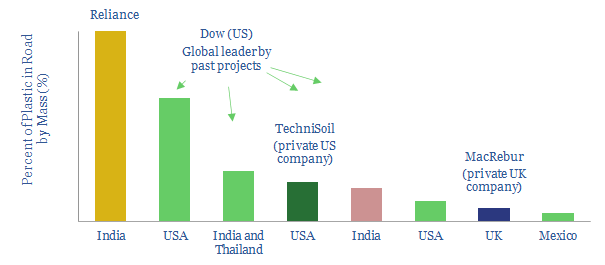
The opportunity is emerging to absorb mixed plastic waste, turning plastic into roads, displacing bitumen from road asphalts. We find strong economics, with net margins of $200/ton of plastic, deflating the materials costs of roads by c4%. The challenge is scaling the opportunity beyond 20MTpa, as unrecycled waste plastics surpass 320MTpa. Leading companies include Dow (US, public) and MacRebur (UK, private). Full details are covered in our new 6-page note.
Pages 2-3 outline the confluence between the road-building indsutry and the plastic waste problem, covering market sizes and costs.
Page 4 is a table of 15 projects we have screened so far, mainly from 2019-20, using modified mixed plastic waste as a road-binder, including key facts and stats.
Page 5 outlines the economics, by analogy to our recent research into plastic pyrolysis (and still extremely exciting) and for road-building more broadly.
Page 6 addresses the challenge of scalability of turning plastics into roads, using data and estimates for the percent of mixed plastic going into road materials.
Qnergy: reliable remote power to mitigate methane?
This short note profiles Qnergy, the leading manufacturer of Stirling-design engines, which generate 1-10 kW of power, for remote areas, where a grid connection is not available. The units are particularly economical for mitigating methane emissions, with a potential abatement cost of $20/ton of CO2-equivalents avoided.
750,000 bleeding pneumatic devices around the oil and gas industry are the largest single source of methane leaks, with each medium-bleed device leaking an average of 1.5T of methane per year, comprising 35% of the oil and gas industryโs total emissions (chart below, data here).
We have screened the US onshore space, operator-by-operator, acreage position by position, to see who most urgently needs to replace bleeding pneumatics (chart below, data here, note here). But how will they be replaced?
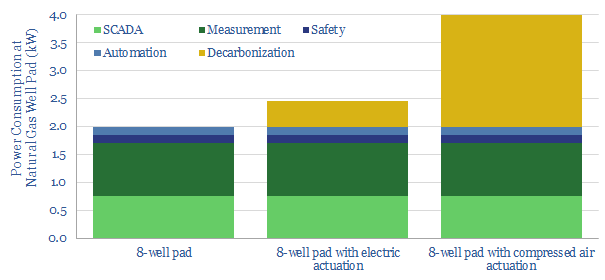
The challenge is power. An 8-well pad will typically require 2kW of electricity, which is low because the pneumatic pressure of natural gas is used in control and actuation of valves. The power demands rise to 4kW if compressed air is used in lieu of methane. Compressed air is reliable, easy to retrofit and does not cause warming when it bleeds into the atmosphere. But a compressor is needed, and the compressor needs to be powered (below).
Qnergyโs Powergen product uses a Stirling engine to generate electricity from heat. It is fuel agnostic and can run on waste heat or in-basin gas.
The PowerGen product was launched in 2017 and its adoption has been growing at a 300% CAGR. The company now also manufactures and sells compressed air pneumatic devices, which will be powered by its Stirling engines. The 5,650 series generates 5.7kW of power from 1.4mcfd of gas inputs (implying c30% thermal efficiency).
NASA has accredited the design as the most reliable ever invented for a heat engine. One of the first units has now run for 24,000 hours without requiring maintenance (equivalent to driving a car to the moon and back 2x). Design life is estimated at over 60,000 hours (7-years). The engine runs between -40C in Alaska and 60C desert installations. Each unit is also remotely monitored, with live support, for preventative maintenance and to detect issues.
Total cost of ownership for Stirlingโs Powergen is cited as the lowest cost power solution to replace bleeding pneumatic devices: costing $100k for Qnergy unit, $150k for a microturbine, $320k for a combination of renewable power and fuel cells, and c$380k for a thermo-electric alternative.
Emissions reductions from each Qnergy Powergen unit saves 325T of CO2e-emissions per annum, while powering each unit will emit 25T of CO2e, for a net saving of 300T/CO2e. At a total cost of $100k, this implies a CO2 abatement cost of $20/ton over a c15-year life of a Qnergy Powergen unit.
For our published screen of companies in methane mitigation, please see our data-file here.
For Qnergy’s latest presentation, see the video below, and please let us know if we can helpfully introduce you to the team at Qnergy.
Do Methane Leaks Detract from Natural Gas?
Some commentators criticize that methane leaks detract from natural gas as a low-carbon fuel in the energy transition. Compared with CO2, CH4 is a 25-125x more potent greenhouse gas (depending on the timeframe of measurement). Hence, leaking 2.7-3.5% of natural gas could make gas “dirtier than coal”. However, for an apples-to-apples comparison, we must also consider the methane leaks from coal and oil. Natural gas value chains have the lowest methane leakage rates of the three.
When combusted, natural gas emits >50% less CO2 than coal, at c320kg/boe versus as much as 850kg/boe. Generating 1MWH of power from natural gas emits 0.35T of CO2, versus 0.85T for coal (chart below, data here).
But it has been criticized by some commentators that natural gas value chains leak methane. Methane is a 120x more potent greenhouse gas than CO2. It degrades over time, due to hydroxyl radicals in the atmosphere. So its 20-year impact is 34x higher than CO2 and its 100-year impact is 25x higher. Therefore, if c2.7-3.5% of natural gas is “leaked” into the atmosphere, natural could be considered a “dirtier” fuel than coal (chart below, model here).
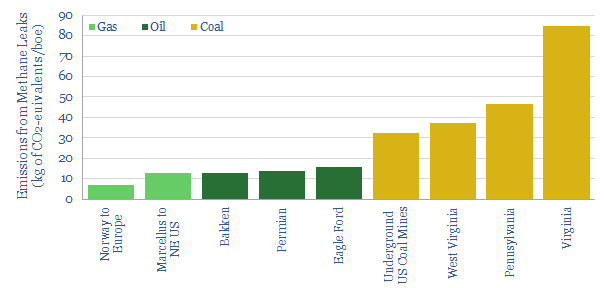
Is this comparison apples-to-apples? After tabulating EPA disclosures, we find that the US underground coal mining industry emitted 1.4MT of methane in 2018. This is because natural gas often desorbs from the surface of coal as it is mined, and can thus be released into the atmosphere. For comparison, 250M metric tons of coal were produced from underground mines in 2018, out of 700MT total coal production. In other words, for every ton of underground coal production, the methane leakage rate was 0.6%, equivalent to around 33kg/boe (chart below, data here).
For comparison, similar EPA disclosures imply that the methane leakage rate in the upstream US oil and gas industry ranges from 0.1% through to 1.1%, with an average of 0.26% (chart below). The data are available here, by basin and by operator.
The US upstream methane leakage rate also appears to be much higher for associated gas in oil basins than non-associated gas in gas basins. The Marcellus is the lowest-leak basin in our sample at 0.1%, versus the Permian, Bakken and Eagle Ford at 0.4-0.5% (chart below, which also correlates the leakage rates with the number of pneumatic devices).
The fairest comparison must also add in the methane leaks from gas gathering, processing and distribution to end-customers (chart below), in order to capture the methane emissions expected across the entire gas value chain. This takes our estimate for total US methane leaks to 0.6% of commercialised gas. Leading the industry, we find the total end-to-end value chain taking Norwegian gas to European consumers leaks around 0.23% of the methane (note here).
Converting back into energy-equivalent units is the most comparable metric, to assess the methane leakage rates of different energy resources. The average ton of coal mined under the US contains 23mmbtu of energy (11,584btu/lb). The average ton of oil contains 40mmbtu and the average ton of gas contains almost 50mmbtu. In turn, this is because greater molar portions of oil and natural gas are from hydrogen molecules, which are very light, but generate energy when they are combusted into water vapor. Dividing through, we calculate the methane intensities below.
Looking most broadly, we find the total emissions profiles of commercializing piped natural gas will tend to run at 25kg/boe (chart below, model here), the total emissions profile of producing coal will tend to run at 50kg/boe (model here) and the total emissions profile of commercializing oil will tend to run at 60kg/boe (model here). This is deeply favorable for the credentials of natural gas as a low-carbon fossil fuel. It adds to the favorable credentials for combusting natural gas versus other fossil fuels.
None of this is to exonerate leaks in the natural gas industry, which remains an urgent challenge for upstream producers to resolve. We are excited by the opportunity and have recently screened companies in the supply chain that can help mitigate methane (chart below, note here, screen here).
What producer impacts? We have also screened the leading and lagging operators around the industry, as ranked by their methane leaks, and after looking across 750,000 bleeding pneumatics that need to be phased out (chart below, data here).
Across all of our research, we find very strong credentials for natural gas as the fuel for the energy transition. All of our research into gas opportunities is linked here; and our work into LNG is linked here.
If a tree falls in a forest…
Carbon-offsets, specifically forestry projects, can sequester 15bn tons of CO2 per annum, helping to accommodate 400TCF of gas per year and 85Mbpd per oil in a fully decarbonized energy system by 2050. The cost is below $50/ton, placing forests among the the most economic ways to decarbonize global energy, by a factor of c6x.
It is also a golden opportunity for climate-conscious energy companies to uplift their NAVs by 15-25%, generating and commercialising carbon offsets. The natural point of sale is together with the purchase of the fuel. (schematic below).
But a recurrent challenge goes as follows: if you eventually cut down the trees in the forest, do they still sequester CO2? (like a 21st century climate-variant of Bishop Berkeleyโs 1710 thought experiment). This short note responds to the challenge.
How to think about CO2 offsets from forests?
Think in terms of land area, rather than in terms of tree tonnage. Each new acre devoted to forests should sequester around 5T of CO2 per annum. In other words, increasing the global land area that is covered by forests would increase the annual removal of CO2 from the atmosphere. Our target of 15bn ton per annum requires repurposing 3bn acres, or around c8% of the worldโs land.
To maximise the rate at which forests offset CO2, our models suggest it is better to cut down old trees and replace them with new trees. This is because a mature forest absorbs CO2 more slowly than a maturing forest (charts below).
There are also economic benefits to re-seeding old forests, earning double-digit returns at a $15/ton carbon price. For contrast, $50/ton is needed to earn a 10% return under greenfield forestry economics (chart below).
But what happens to the wood?
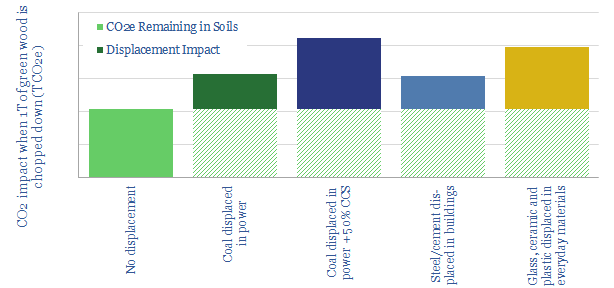
The wood could be burned and the forest will still lock up two-thirds of the CO2. This is because 69% of the CO2 locked up by forests is not stored in the wood, but in the soils beneath the forests, according to the IPCC and the FAO. Again, this carbon will remain fixed in the soils, as long as the land remains devoted to forestry.
Burning the wood also displaces fossil fuels. If sustainably sourced wood is burned in a power plant, it can displace the combustion of fossil fuels, such as coal. Generating 1MWH of power from coal emits 0.85T of CO2; and burning 1ton of coal emits c4T of CO2e. As an example, Drax is currently running the worldโs first carbon-negative power plant at the 3.9GW Selby facility in North Yorkshire. It runs on wood pellets from responsibly managed forests, and a pilot is ongoing to capture the CO2 for sequestration (including using MCFCs, an exciting technology that we recently reviewed in depth, chart below).
It is better if the wood is not burned, but instead used as a raw material. Do not underestimate how long wooden buildings can last, if properly maintained. The oldest wooden structure still standing is Japanโs Horyuji Buddhist temple, constructed in 639AD, and thus standing for over 1,400 years. Other examples include pre-Renaissance Italy (800-years old), Lhasa China (c1,400 years) and parts of the UKโs Greensted Church (c1,000 years old, below). Climatic conditions need to be dry, but not too dry.
The oldest wood still being worked on planet Earth is even older: at 45,000 years old, from the Ancient Kauri forest in Northern New Zealand, which was levelled by a tsunami and preserved in a peat bog. An exception, rather than a rule. But even wood products that end up in landfill effectively sequester CO2.
Wood can displace other materials, and thus carry a further benefit. For example, it takes 1.9T of CO2 to make 1T of steel, around 1T of CO2 per ton of cement, around, 1.3-1.5T of CO2 per T of glass and ceramic, and as much as 5T of CO2 per ton of plastic (chart below). The relative benefit of wood will depend, of course, on the energy intensity of the wood processing. Relative CO2-savings should be possible.
Thus on our numbers, the periodic harvesting of forests should not be considered to detract from the benefit of reforestation projects in offsetting CO2. Each ton of green wood cut down may still entail 1-4T of total CO2 sequestration (chart below). Please find our recent research on the opportunities in CO2-offsets linked here.
Climate science: staring into the sun?
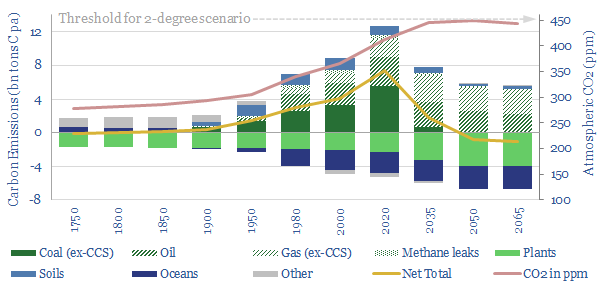
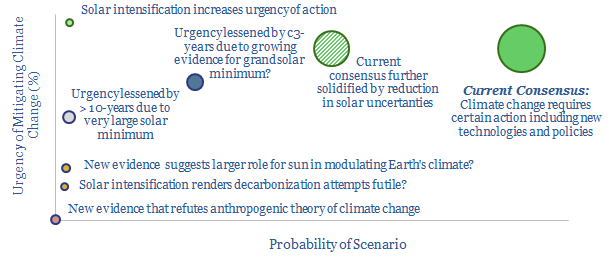
The scientific evidence for anthropogenic climate change is extremely robust, based on the technical papers we have reviewed, warranting better technologies that can decarbonize the global energy system. But the largest uncertainty is our understanding of the sun. Two new satellites (launched in 2018 and 2020) could soon provide unprecedented new data. It is interesting to consider scenarios for how the science could unfold, and how this could alter policies and market sentiment (chart above).
[restrict]
Introduction: Why the Sun Matters?
Much climate science is clear and uncontraversial, making it important to decarbonize the global energy system via better energy technologies. These scientific findings are a guiding reason for our research at Thunder Said Energy.
- Around 1,361 watts per square meter (Wm-2) of solar radiation reaches the Earth’s atmosphere.
- Around 29% is reflected, 23% is absorbed in the atmosphere and 48% is absorbed at the surface.
- CO2 is a greenhouse gas, increasing the portion of solar radiation that is absorbed in th atmosphere.
- At its 1980 concentration level, of 330ppm, CO2 was contributing 1.0 Wm-2 more ‘radiative forcing’ than in 1750. At its 2020 concentration, above 410 ppm, it will be contributing 2.0 Wm-2 more radiative forcing than in 1750.
- CO2 concentrations correlate closely with indisputable rises in global average temperatures, which have increased by around 0.7-1.0C from pre-industrial times, and at an unusually rapid pace.
- The historical precedent is that small changes in climate can instigate large, unpredictable feedback loops.
- Small changes in climate can have large socio-economic consequences.
- Mass extinctions at the ends of Ordivician period (443 million years ago), late Devonian (375mya), Permian (250-260mya) and Triassic (201mya) were all instigated by major climatic changes, killing off 75-96% of life on Earth.
- Better energy technologies, which earn strong returns, are worthwhile whether you believe in climate science or not.
But the role of the sun is much less certain, in our view. The uncertainty makes it harder to model and precisely plan for climate change. It provides a last resort argument for climate skeptics. And long-term solar cycles may sway the sentiment around climate change.
What we know, and what we don’t know, about the sun
The sun undergoes an 11-year sunspot cycle. Specifically, sunspots are dark areas on the solar disc (each tens of thousands of km long, lasting half-a-year), characterized by a strong magnetic field, and associated with warmer solar conditions. Every 11-years, the frequency of sunspots flares up and dies down, causing c1% fluctuation in solar radiation (1.3Wm-2). Each sunspot cycle begins most intensely at the poles and ends most intensely at the sun’s equator (chart below). After each 11-year cycle, the sun’s magnetism mysteriously reverses: North becomes South and South becomes North. Solar cycle 24 began in 2008 and ends in 2020.
Solar cycles have been getting weaker, with each cycle since 1980, which is another mystery. Solar Cycle 24, ending in 2020, has seen the fewest sunspots in at least 200-years (chart here). Solar Cycle 25 is predicted to be even weaker. This has led some scientists to worry that a ‘grand solar minmum’ (GSM) could be imminent…
Grand solar minima. Longer term data on the sun are not directly available, but can be inferred from the studies of isotopes in ice cores or rocks. These data imply the sun spends around one-sixth of its time in a quiet state called a ‘Grand Solar Minimum’ (GSM). 15-25 grand minima have been identified over the past 11,000 years, lasting 70-years on average. Minima and related solar effects have been posited among the triggers of Ice Ages, every 40-100k years since the start of the Pleisocene, 2.6mya. The causes and impacts of these minima are unclear.
The Maunder Minimum, most famously, was a c50-year period from about 1650-1700 โwhen sunspots vanished, for reasons which are not yet fully understoodโ (Meehl et al, 2013), contributing to a โLittle Ice Ageโ. Temperatures fell 0.2-1.0C below the medieval warm period (chart below). Other reconstructions, which are not shown below, have estimated a difference of as much as 2C, and others of almost zero.
We may be going into a minimum. One study notes from cosmogenic isotopes that “in recent decades the Sun has been in a Grand Solar Maximum (GSM) which has lasted longer than all others in the past 9.3 millennia and is expected to end soonโ (Barnard et al, 2011). Another study uses a fully coupled climate model to predict 0.25C cooling from a grand solar minimum, between 2020 and 2070 (Meehl et al, 2013). Papers cited by NASA give a similar estimate, around 0.3C.
There are limited data on longer-term solar cycles. Direct solar measurements via satellite started only in 1978. Routine photographs of the sun have been taken since 1876. Direct temperature records are available since 1850. Observations of sunspots go back c400-years, when telescopes were invented. But all of our longer-term data is inferred from proxy measures.
Some studies postulate even longer-term cycles. In addition to a 350-400 year grand cycle, Zharkova et al (2019) posit a ‘super-grand cycle’ of c2,000 years, troughing in c1600, governed by inertial motion of the solar dynamo, around the ‘barycenter of the solar system’. As we are now 350-400 years on from the Maunder Minimum, another GSM is seen denting temperatures in 2020-2050. But even more alarmingly, the upswing of the longer and larger 2,000 year cycle is then seen causing 1.3C further warming by 2100 and 2.5C further warming by 2600.
No one fully understands these long-term solar cycles. Zharkova’s paper, quoted above, is widely criticized for mistaken assertions about the distances betwen Sun and Earth. Others speculate whether these long-term cycles are random, or modulated by the orbits of planets, the rotation of the sun, or something else.
Most contraversial is the suggestion that the sun – not CO2 – has triggered some of the Earth’s warming since 1750. According to AR5, the latest IPCC report, the increase in radiative forcing due to the sun since 1750 is only 0.05 W/m2, compared to a total increase of 2.29 W/m2, mainly caused by CO2. This is corroborated by NASA data (below), albeit note per our comments above that early data are indirectly inferred not measured. Some studies go even further and downplay whether the ‘Little Ice Age’ was even a globally coherent event (Neukom, 2019). But on the other side of the spectrum, other studies based on niche isotope measurements have estimated solar irradiance increased by as much as 4-6 Wm-2 since 1750. Other papers in the last decade claim greater solar activity in the second part of the 20th century than any time in the past 10,000 years. We have not reviewed all of these studies. As a reasonably literate analyst, it is merely noteworthy that there appears to be such a large apparent range of estimates and uncertainty surrounding the sun’s contribution to global temperatures.
What’s Changing: New Data? New Models?
To begin addressing the uncertainties about the sun, two new satellites are going to help. Both have recently launched into space. And their evidence could yield some meaningful new evidence, helping us to model the sun’s future intensity.
The European Space Agency’s Solar Orbiter satellite was launched into space on the 10th February 2020. During its 7-year mission, the satellite will make close approaches to the sun every 6-months, to observe the way magnetic activity builds up. In order to gain a novel perspective, the satellite will use the gravitational pull of Venus to slingshot itself out of the plane where all the planets orbit the sun, in order to observe the solar system from a 25-degree angle. This could help understand the sun’s poles and magnetism much better.
NASA’s Parker Solar Probe was launched in August-2018, billed as the first mission ever to “touch” the sun’s outer corona. It will reach 6M km from the sun’s surface, compared to Earth, which is c150M km away. It will assess the structure and dynamics of the sun’s coronal plasma, magnetic fields and energy flows. A new wave of 47 research papers was released in February-2020, based on the mission’s data and findings so far.
What Implications for Energy Transition?
What is not conceivable to us is that any imminent data source will disconfirm the Earth’s recent warming trend, its links with CO2, or the need to decarbonize global energy. Indeed, the most likely outcome of deeper solar research is to allay the mysteries described above.
But the new data could nevertheless have profound consequences for companies, investors, the global economy and the world, which may be interesting to consider.
What if we are due for a grand solar minimum? A 0.2-0.3C downward influence on temperature from 2020-2070 may ‘buy more time’ for the incubation of new technologies (at least 3-years, according to NASA, possibly more). Some commentators talk about acting urgently to stop climate change, which may entail policies that are economically debilitating. Immediately imposing debilitating policies may not be needed if evidence strengthens for a GSM.
What if we are due for a very large solar minimum? As we have discussed, some climate scientists have postulated a much larger role for the sun, with potentially larger temperature reductions ahead by 2050, on the scale of 1-2C. There is a remote chance that new solar data may stoke these theories. Although remote, it is fascinating to consider how market sentiment might change, if we suddenly found our carbon budgets doubled, or our timeline to achieve an energy transition pushed out by 20-years.
What if we are due for further solar intensification? As we have also discussed, there is a possibility that a further 1.3-2.5C of warming lies ahead, due to solar intensification, linked to a super-grand solar cycle. It is difficult to imagine what would happen if evidence mounted for such a theory. Would it tempt the world to give up on mitigating climate change, or to double down?
Our research aims to identify economic technologies that can best drive a full decarbonization of the global energy system by 2050 (chart below, data-file here). As a researcher, it is always important to stress-test your firmly-held premises, and to consider what new evidence could unseat them, hence we hope you found this short article useful.
Sources:
Meehl, G., Arblaster, J. M. & Marsh, D. R. (2013). Could a future โGrand Solar Minimumโ like the Maunder Minimum stop global warming? Geophysical Research Letters
Usoskin, I. G. (2017). A history of solar activity over millennia. Living Review of Solar Physics.
Barnard, L. Lockwood, M., Hapgood, M. A., Owens, M. J. & Davis, C. J. (2011). Predicting space climate change. Geophysical Research Letters.
Neukom, R., Steiger, N., Gomez-Navarro, J. J., Wang, J. & Werner, J. P. (2019). No evidence for globally coherent warm and cold periods over the pre-industrial common era. Nature, 571
What will happen during a new Maunder Minimum? https://www.mwenb.nl/what-will-happen-during-a-new-maunder-minimum/
Zharkova, V. V., Shepherd, S. J., Zharkov, S. I. & Popova, E. (2019). Oscillations of the baseline of solar magnetic field and solar irradiance on a millennial timescale. Nature Scientific Reports
[/restrict]
Could new airships displace trucks?
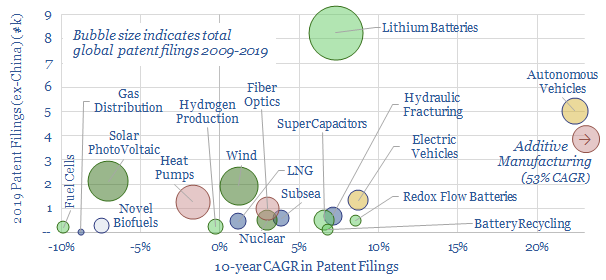
In 2019, TOTAL co-filed two patents with an airship-technology company, Flying Whales, aiming to lower the logistical costs of moving capital equipment into remote areas. An example is shown above. The LCA60T is envisaged to carry up to 60T of cargo (c4x the capacity of a truck), with a range of 100-1,000km. This short note assesses the opportunity, and whether these new airships could displace trucks, or lower diesel demand. We are most excited by the impact for onshore wind.
[restrict]
Flying Whales is a French company, originally supported by the French Public Forest Office, to progress transportation technologies that could help evacuate timber. It has since raised โฌ200M, including from BPI and Chinese backers.
Designs for the LCA60T are shown below, from TOTAL and Flying Whales’ patent. The ship is 154m x 68m, constructed from rigid carbon-fiber composite, generating aerostatic lift from 10, unpressurised cells of helium.
Its distributed electric propulsors are similar to those in the flying car concepts that excite us. We recently re-assessed our rankings of different flying car concepts here.
Technical Readiness is at Level 5-6, but rapid progress is foreseen: Wind-tunnel testing in 2019, the first test phase in 2020, the first prototype flight in 2021. Flying Whales company plans to construct a plant in Bordeaux, for โฌ90M, to produce 12 airships per year by 2022, ramping up to โฌ5bn of sales within 10-years, from constructing 150 airships in France and China.
What Advantages?
Airships can rapidly reach places that trucks cannot, particularly in remote areas without naviable roads. They are helped by vertical take-off and landing (VTOL), and a system of a dozen winches, that can lower cargoes.
Airships can also carry large loads, up to 60T, at speeds up to 100kmph. For comparison, a typical truck carries c14T, a Sikorsky S-64 SkyCrane carries 9T and the largest Russian Mil Mi-26 helicopters can carry 20T.
Economics are better than helicopters. Flying Whales estimates that its deliveries could be 20x less expensive than helicopters, which can cost c$1M/day or at least $11,000/hour. The Flying Whales should cost c$50,000/day, which perhaps translates into c$5,000/hour. This is still much more pricey than a truck ($60-200/hour), making Flying Whales best suited to large loads in remote locations. The technology is unlikely to replace trucks on highways.
Wind turbines? Where these capabilities may best come together is in the delivery of wind turbine blades, where the logistics can be notoriously challenging (chart below). All three turbine blades could in principle be delivered as a single Flying Whales Cargo, slashing the c$30,000-100,000 delivery costs per turbine, that can be incurred in the onshore wind industry.
What Energy Economics?
The energy economics of Flying Whales’ airships should be a great improvement on helicopters, but still fall short of trucks, we estimate.
Specifically, the Flying Whales airships consume 1.5MW at peak cruise speeds around 100kmph. This power consumption is equivalent to c100 gallons of diesel per hour, fed into a diesel generator, which in turn feeds the propulsion units. Total fuel economy thus runs at 30 ton-miles per gallon (chart below).
By contrast, we estimate helicopters consume c5,000 gallons of jet fuel per hour, for fuel economies of 1.5 ton-miles per hour.
But trucks consume only c10 gallons of diesel per hour, for a fuel economy of c67 ton-miles per gallon.
Fuel consumption may also be higher for large airships, during strong gusts of wind. To stabilize the Airships, they will contain 3MW ultracapacitors, to provide bursts of energy.
The most efficient freight delivery method remains via container ships and trucks, according to our data-file (chart below), which now also includes the calculations above for Airships.
We conclude that new airships may help deflate delivery costs in remote locations: particularly for onshore oil and gas, onshore wind and niches in the construction sector. But they are unlikely to displace materialy volumes of diesel demand, which remain in our models of long-run oil demand (chart below).
Source: Kuhlmann, H. F., (2019). Method for Transporting a Payload to a Target Location and Related Hybrid Airship, Patent WO2019092471A1
[/restrict]
Chevron: SuperMajor Shale in 2020?
SuperMajorsโ shale developments are assumed to differ from E&Psโ mainly in their scale and access to capital. Superior technologies are rarely discussed. But new evidence is emerging. This 11-page note assesses 40 of Chevronโs shale patents from 2019, showing a vast array of data-driven technologies, to optimize every aspect of unconventionals.
Page 2 explains how we assessed Chevron’s shale patents, to identify technologies that could support guidance for 900kboed of Permian production by 2023.
Page 3 sets out Chevron’s technologies for shale exploration and appraisal, based on recent seismic patents.
Page 4 sets out Chevron’s technologies for shale drilling, based on recent patents, many of which are co-filed with Halliburton, around a specific innovation.
Pages 5-8 set out Chevron’s technologies for shale completions, through an array of sophisticated, proprietary and increasingly digital technologies. These will not only help in the Permian, but also in de-risking international basins.
Page 8 sets out Chevron’s potential edge in completion fluids. We are particularly excited by the promising results from field-tests of anionic surfactants.
Page 9 sets out Chevron’s data-driven flowback practices, including productivity gains from field tests in the Vaca Muerta.
Pages 10-11 set out Chevron’s technologies for upgrading NGLs into gasoline-, jet- and diesel-range products, using industry-leading ionic liquid catalysts.
Page 11 concludes with implications for the broader shale industry.