Nuclear power: what role in the energy transition?

Nuclear power in the energy transition

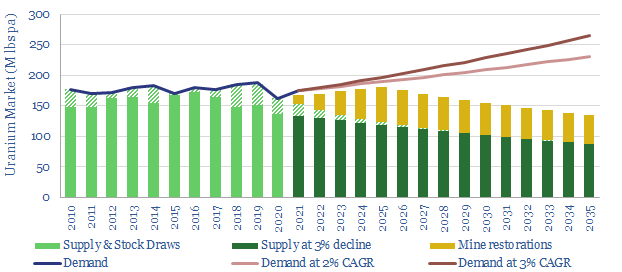
Uranium markets could be 50-75M lbs under-supplied by 2030. This deficit is deeper than other commodities in our roadmap to net zero. Demand is driven by China, constructing reactors for 50-70% less than the West, yielding zero carbon power at 6-8c/kWh. This 18-page note presents the outlook for nuclear in the energy transition and screens uranium miners.


An overview of the nuclear power industry is outlined on pages 2-5, in order to understand the market, its sub-components, and the energy-economics of nuclear power generation.

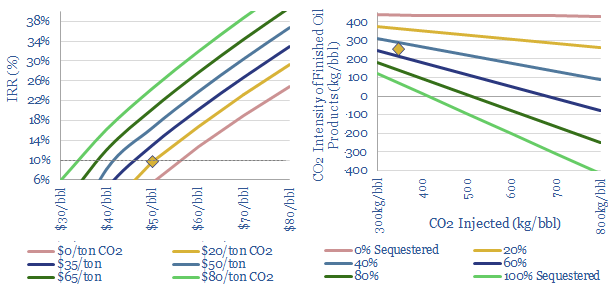
Capex costs have held back nuclear growth in the West, as heavy investments and devastating delays can kill IRRs and require 16c/kWh levelized costs (pages 6-7).

China is different, constructing new reactors for 50-70% less than the West, yielding passable economics at 6-8c/kwh, while generating clean baseload power (pages 8-9).

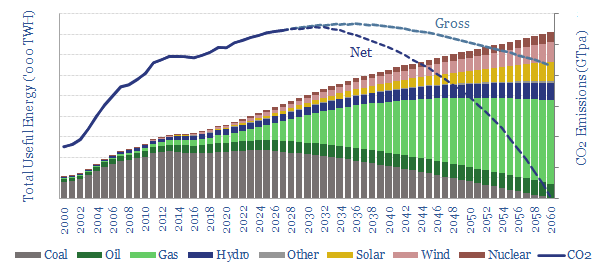
China drives our demand forecasts, underpinning 75% of future global demand on our ‘roadmap to net zero’, with stark upside as a diversification to under-supplied LNG markets, if China exports its technology and as new start-ups require inventory builds (pages 10-13).

Impacts on the uranium market are quantified on page 14. We are bridging to 50-75M lbs of under-supply by 2030, with risks skewed to the upside.

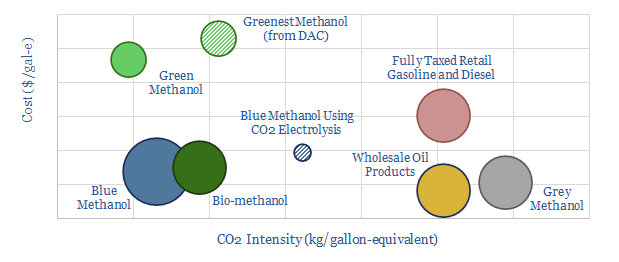
Uranium prices must re-inflate, from sub-$30/lb to $60-90/lb marginal costs (page 15).

Uranium miners are screened on pages 16-18, including profiles of ten public companies, from incumbents to early-stage developers. Rare Earth metals are a common by-product of uranium mining and also relevant to the energy transition.

Oil demand: the rise of autonomous vehicles?

medium-term oil demand

We are raising our medium-term oil demand forecasts by 2.5-3.0 Mbpd to reflect the growing reality of autonomous vehicles. AVs eventually improve fuel economy in cars and trucks by 15-35% and displace 1.2 Mbpd of air travel. But their convenience also increases total travel demand. This 20-page note outlines the opportunity and leading companies.


Patent activity into autonomous vehicles is accelerating at the second-fastest rate of any technology in the future of energy. We review fifty patents into AVs and conclude Level 5 autonomy remains science fiction, but Level 4 applications are credible within 2-5 years (pages 2-5).

Impacts on trucking fuel economy are explored on pages 6-8, including technical papers into platooning and other efficiency gains.

Impacts on passenger vehicles are presented on pages 9-10. Efficiency gains are offset by greater demand for increasingly convenient mobility.

Long distance journeys above 100-miles comprise 40% of all travel miles today. 50% of this market is currently serviced by plane, but we expect switching from aviation to autonomous vehicles (pages 11-14).

Impacts on total oil demand are bridged on pages 15-17, running through our assumptions, category-by-category. Our 2030-40 oil demand forecasts are raised by 2.5 – 3.0 Mbpd.

Five broad implications for different industries and sub-industries are spelled out on page 18. We are increasingly constructive on fuel retail businesses, particularly those selling carbon offsets to decarbonize long-distance car trips.

Leading companies in autonomous vehicles are diligenced in our full screen. Ten of the most exciting companies are profiled on pages 19-20.

LNG in the energy transition: rewriting history?

Outlook for LNG in the energy transition

A vast new up-cycle for LNG is in the offing, to meet energy transition goals, by displacing coal and improving industrial efficiency. 2024-25 LNG markets could by 100MTpa under-supplied, taking prices above $9/mcf. But at the same time, emerging technologies are re-shaping the industry, so well-run greenfield projects may resist the cost over-runs that marred the last cycle. This 18-page note outlines who might benefit and how.


Global LNG supplies need to rise at an 8% CAGR to meet the energy transition objectives in our decarbonization roadmaps for China, Europe and broader industrial heat, as spelled out on pages 2-4.

But global LNG supplies are currently only set to rise at half of this rate, leaving a potential supply gap of 100MTpa by mid-decade, exacerbated by delays and deferrals amidst COVID (page 5).

Marginal costs for the LNG industry are disaggregated on pages 6-8, based on a detailed breakdown of capex costs, including upside-downside analysis of project characteristics.

Can future projects resist re-inflation if the industry undergoes a vast new up-cycle, as foreseen in our models? We present our reasons for optimism on pages 9-14, outlining evidence from 40 recent patents, plus the best new technologies from technical papers. This shows what the most resilient and lowest-risk projects will look like.

Beneficiaries in the LNG supply chain are described on pages 15-16, including next-generational modularization technologies, drone technologies to de-risk construction and the use of additive manufacturing for hard-to-manufacture components.

Beneficiaries among new LNG projects are described on pages 17-18, profiling examples and opportunities.

Shifting demand: can renewables reach 50% of grids?

Shifting demand for wind and solar

25% of the power grid could realistically become ‘flexible’, shifting its demand across days, even weeks. This is the lowest cost and most thermodynamically efficient route to fit more wind and solar into power grids. We are upgrading our renewables ceilings from 40% to 50%. This 22-page note outlines the growing opportunity in demand shifting.


Renewables would struggle to reach 50% penetration of today’s grids, due to their volatility. Pages 2-7 quantify the challenges, which include capacity payments for non-renewable back-ups, negative power pricing >20% of the time, >10% curtailment and 30% marginal cost re-inflation for new projects.

But a greater share of renewables would help decarbonization. This objective is explained on page 8, showing the relative costs and CO2-intensities of electricity technologies.

Renewable electricity storage is not the solution. It is costly and thermodynamically inefficient, which actually dilutes the impact of renewables. Costs and efficiency losses are quantified for batteries and for hydrogen on pages 9-11.

Demand shifting is a vastly superior solution. Pages 12-17 outline half-a-dozen demand-shifting opportunities that have been profiled in our research to-date. Companies in the smart energy supply chain are also noted and screened.

What impacts? We model that up to 25% of the grid can ultimately be demand-flexible, while this can help accommodate an additional 10pp share for renewables in the grid, before extreme volatility begins to bite (see pages 18-19).

Europe leads, and we now assume renewables can reach 50% of its power grid by 2050, with follow-through consequences for our gas and power models (page 20).

Our global renewables forecasts are not upgraded, as the bottleneck on a global basis is simply annual capacity additions, which must treble between 2020 and 2050, in our roadmap to ‘net zero’. (pages 21-22).

Industrial heat: the myth of electrify everything?

Electrification of industrial heat

“Electrify everything then decarbonize electricity”. This mantra is popular, but dangerously incorrect for industrial heating. It raises output costs by 10-110% without any material CO2 savings. This 19-page note presents five separate case studies in the steel, cement, glass, petrochemical and paper industries, which exceed 15% of global CO2. Only a CO2 price is likely to maximize efficiency gains across multiple disparate industries.


Industrial heating comprises 20% of global CO2 emissions. We outline the market by process, by temperature range and by fuel sources on pages 2-5.

The costs and CO2 intensity of gas, coal and electricity are broken down on pages 5-7, in units of kg/kWh and c/kWh, along with workings. This analysis shows electrification can only save CO2 if it confers a step-change in exergetic efficiency. Which needs to be assessed process-by-process, industry-by-industry.

Electrification of the steel industry is discussed on pages 8-9. Over half of the emissions are chemical emissions from coking. The other half is from blast furnaces. Recycling scrap metal in electric arc furnaces is the best electrification opportunity we can find for any high-grade heating process, but it also has drawbacks.

Electrification of the cement industry is discussed on pages 10-11. Approximately half of the emissions are chemical emissions from calcining CaCO3. Because cement costs are so low, there is a risk that electrification doubles total production cost.

Electrification of the plastics industry is discussed on pages 12-13. Presently there is no commercially available electric alternative to an ethane cracker, although some interesting concepts are at early stages of technical readiness.

Electrification of the glass industry is discussed on page 14. Again, the process is challenging to electrify, and like cement, this can greatly increase production costs.

Electrification of the paper industry is discussed on page 15. Vast quantities of water and steam make this industry one of the least heat-efficient globally. Heat exchangers and heat pumps can help. But they may actually increase CO2 intensity if electricity replaces wood offcuts and other sustainable biomass, currently used as a low carbon fuel.

A comparison of the costs and CO2 intensities of different electrification technologies ties all of our work together on page 16. At best, electrification will have a neutral impact on the CO2 intensity of industrial heat, if renewable penetration ever reaches 50% of the grid. At today’s typical grid mixes, electrification may increase CO2 intensity 20-50%.

Better options are needed to decarbonize industrial heat, as outlined on pages 17-19. No simple mantra like “electrify everything” can substitute for effective process engineering, which is highly site-specific. A CO2 price could incentivize many of these initiatives. We outline attractive options and who benefits.

Vertical greenhouses: what future in the transition?

Vertical greenhouses in the energy transition

Vertical greenhouses achieve 10-400x greater yields per acre than field-growing, by stacking layers of plants indoors, and illuminating each layer with LEDs. Economics are exciting. CO2 intensity varies. But it can be carbon-negative in principle. This 17-page case study illustrates how supply chains are localizing and more renewables can be integrated into grids.


The first rationale for vertical greenhouses is to grow food closer to the consumer, which can save 0.6kg of trucking CO2 per kg of food. Eliminating freight is much simpler than decarbonizing freight (pages 2-4).

The second rationale for vertical greenhouses is that they are 10-400x more productive per unit of land, hence they can free up farmland for reforestation projects that absorb CO2 from the atmosphere (pages 5-6).

The third rationale for vertical greenhouses is that their LED lighting demands are flexible, which means they can absorb excess wind and solar, in grids that are increasingly laden with renewables. They are much more economical at achieving this feat than batteries or hydrogen electrolysers (pages 7-10).

The overall CO2 intensity of vertical greenhouses depends on the underlying grid’s CO2 intensity, but the process can in principle become carbon negative (pages 11-13).

Interestingly, we also think vertical greenhouses can smooth our volatile power grids by demand shifting.

The economics are exciting. We model 10% IRRs selling fresh produce at competitive prices, with upside to 30% IRRs if fresher produce earns a premium or operations can be powered with low-cost renewables when the grid is over-saturated (pages 14-15).

Leading companies in vertical greenhouses and in their supply chain are discussed on pages 16-17.

China: can the factory of the world decarbonize?

Decarbonization of China's economy?

China now aspires to reach ‘net zero’ CO2 by 2060. But is this compatible with growing an industrial economy and attaining Western living standards? Our 16-page note finds the best middle ground to balance these objectives: Coal is phased out, oil demand plateaus at 20Mbpd, gas rises by a vast 10x to 300bcfd, and 9GTpa of gross CO2 emissions must be captured or offset. The biggest challenges are geopolitics and sourcing enough LNG.


The vastness of China’s industrial economy is outlined on pages 2-4. China’s industrial complex consumes more energy than the entire USA. China’s textile manufacturing industry alone consumes more energy than the entire power grid of Spain. We provide data by major sector and by energy source.

It is more challenging to decarbonize an industrial economy than a service-oriented economy. These are our findings on pages 5-6.

A high case scenario is laid out on pages 7-9. It is not impossible that China’s CO2 doubles by 2060, more than offsetting all decarbonization efforts in the West. This would be problematic.

A low case scenario is laid out on pages 10-12. The easiest route to reaching net zero is if China chooses slower economic growth and less economic development for its citizens. But is this remotely fair or realistic?

A middle-ground solution is given on pages 13-15. This is our base case. Full decarbonization is achieved, without materially sacrificing growth and development. But vast changes are needed in China’s energy sector.

The largest bottleneck to achieving this bottleneck is whether China can source enough gas, especially LNG, to reduce its reliance on coal, as argued on page 16. The ramp-up in renewables is also vast, but realistic, we think.

CO2-EOR: well disposed?

CO2-EOR economics to decarbonize oil

CO2-EOR is the most attractive option for large-scale CO2 disposal. Unlike CCS, which costs over $70/ton, additional oil revenues can cover the costs of sequestration. And the resultant oil is 50% lower carbon than usual, on a par with many biofuels; or in the best cases, carbon-neutral. The technology is fully mature and the ultimate potential exceeds 2GTpa. This 23-page report outlines the opportunity.


The rationale for CO2-EOR is to cover the costs of CO2 disposal by producing incremental oil. Whereas CCS is pure cost. These costs are broken down and discussed on pages 2-5.

An overview of the CO2-EOR industry to-date is presented on pages 6-7, drawing on data-points from technical papers.

Our economic model for CO2-EOR is outlined on pages 8-10, including a full breakdown of capex, opex, and sensitivities to oil prices and CO2 prices. Economics are generally attractive, but will vary case-by-case.

What carbon intensity for CO2-EOR oil? We answer this question on pages 11-12, including a debate on the carbon-accounting and a contrast with 20 other fuels.

The ultimate market size for CO2-EOR exceeds 2GTpa, of which half is in the United States. These numbers are outlined on pages 13-15.

Technical risks are low, as c170 past CO2-EOR projects have already taken place around the industry, but it is still important to track CO2 migration through mature reservoirs and guard against CO2 leakages, as discussed on pages 16-17.

How to source CO2? We find large scale and concentrated exhaust streams are important for economics, as quantified on pages 18-21.

Which companies are exposed to CO2-EOR? We profile two industry leaders on page 22.

What implications for reaching net zero? We have doubled our assessment of CO2-EOR’s potential in this report, helping to reduce the costs in our models of global decarbonization.

Carbon negative construction: the case for mass timber?

Cross laminated timber costs in carbon negative construction

The construction industry accounts for 10% of global CO2, mainly due to cement and steel. But mass timber could become a dominant new material for the 21st century, lowering emissions 15-80% at no incremental costs. Debatably mass timber is carbon negative if combined with sustainable forestry. This could disrupt global construction. This 17-page note outlines the opportunity and who benefits.


CO2 emissions of the construction industry are disaggregated on pages 2-3. Some options have been proposed to lower CO2 intensity, but most are costly.

Sustainable forestry also needs an outlet, as argued on pages 4-7. Younger forests grow more quickly, whereas mature forests re-release more CO2 back into the atmosphere.

The case for cross-laminated timber (CLT) is outlined on pages 9-11, describing the material, how it is made, its benefits, its drawbacks, and its CO2 credentials.

CLT removes CO2 at no incremental cost, illustrated with specific case studies and cost-breakdowns on pages 12-13.

CLT economics are attractive. We estimate 20% IRRs are achievable for new CLT production facilities on page 14.

Leading companies are described on pages 15-16, including large listed companies, through to private-equity backed firms and growth stage firms.

Our conclusion is that CLT could disrupt concrete and steel in construction, helping to eliminate 1-5GTpa of CO2 emissions by mid-century.

Methanol: the next hydrogen?

Methanol as a clean transportation fuel

Methanol is becoming more exciting than hydrogen as a clean fuel to help decarbonize transport. Specifically, blue methanol and bio-methanol are 65-75% less CO2-intensive than oil products, while they can already earn 10% IRRs at c$3/gallon-equivalent prices. Unlike hydrogen, it is simple to transport and integrate methanol with pre-existing vehicles. Hence this 21-page note outlines the opportunity.


The objectives and challenges of hydrogen are summarized on pages 2-3. We show that clean methanol can satisfy the objectives without incurring the challenges.

An overview of the methanol market is given on pages 4-5, to frame the opportunity, particularly in transportation fuels and cleaner chemicals.

Conventional methanol production is described on 6-8. We focus upon the chemistry, the costs, the economics and the CO2 intensity.

Bio-methanol is modelled on pages 9-10. We also focus upon the costs, economics and CO2 intensity, including an opportunity for carbon-negative fuels.

Blue methanol is outlined on pages 11-15. Converting CO2 and hydrogen into methanol is fully commercial, based on recent case studies, which we also use to model the economics and CO2 credentials.

Green methanol is more expensive for little incremental CO2 reduction, and indeed some routes to green methanol production are actually higher-CO2 (pages 16-18).

Companies in the methanol value chain are profiled on pages 19-20. We focus upon leading incumbents, technology providers and private companies commercializing clean methanol.

Our conclusion is that methanol could excite decision-makers in 2021, the way that hydrogen excited in 2020. This thesis is spelled out on page 21.

Copyright: Thunder Said Energy, 2019-2024.