Decarbonizing global energy: the route to net zero?

route to net zero

This 26-page report aggregates all of our work in 2020 and presents the best route to reach ‘net zero’ CO2. The global energy system can be fully decarbonized by 2050, for an average CO2 cost of $42/ton. Remarkably, this is almost half the cost foreseen one year ago. 85Mbpd of oil and 375TCF pa of gas are still required in this 2050 energy system, together with efficiency technologies, carbon capture and offsets.

Important note: our latest roadmap to net zero is from 2022, published here. But this note remains on our website, for transparency into our views at the end of 2020.


Our modelling framework for the decarbonization of global energy is explained on pages 2-6, looking across 90 thematic research reports and 270 models, which have featured in our work to-date. The aim is to find the lowest-cost route to meeting global energy demand, while removing all of the CO2.

The framework joins up with our models of supply-demand models of global energy, oil, LNG, European gas, the total US economy and the climate system. Supply shortages are noted in many of these markets on pages 7-8.

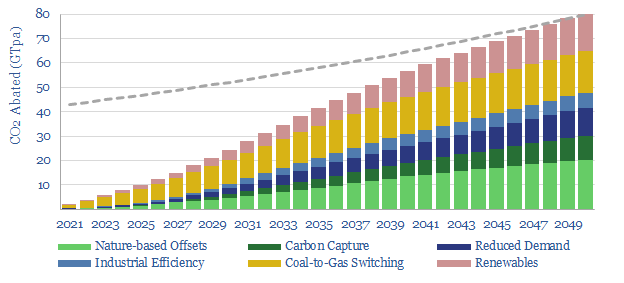
How can this be a decarbonized energy system if there is still 85Mbpd of oil and 375TCF of gas? Our bridge includes carbon capture and carbon offset, as shown on page 9.

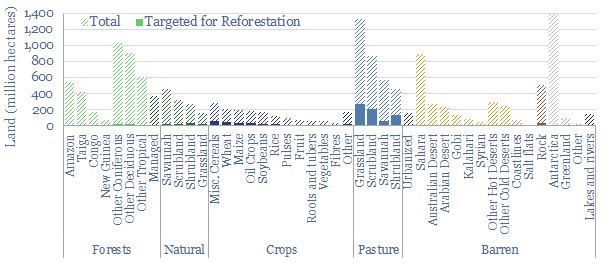
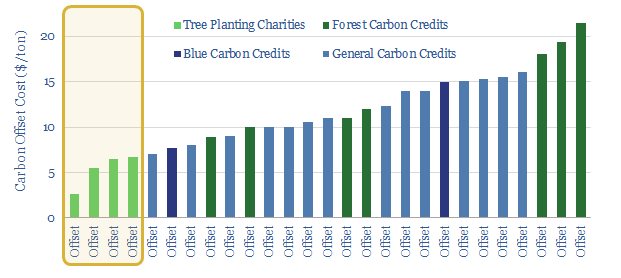
Nature based solutions are profiled in detail on pages 10-14. This includes data into the CO uptake rates in reforestation and soil carbon projects, and quantification of the land that is available for both.

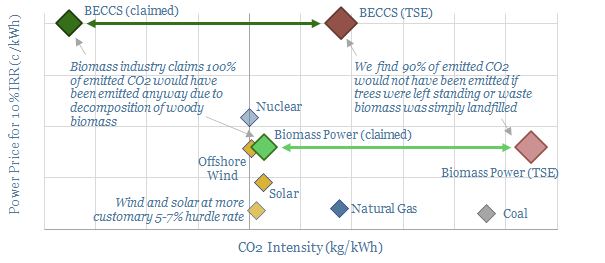
Carbon capture technologies are profiled in detail on pages 15-18. This is not simple CCS, but an array of 35GTpa potential, spanning a dozen themes, evaluated in our work.

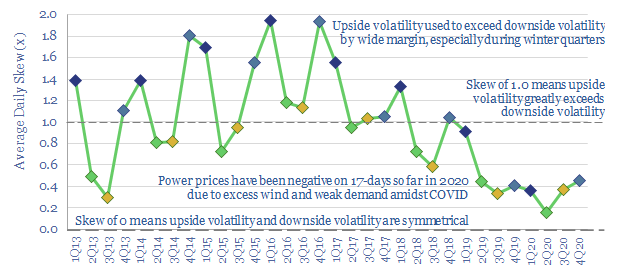
Why not rely more on renewables in the roadmap? Our work already assumes the ascent of wind and solar will double in speed, and reach 17% of total global energy by 2050. This would be a monumental achievement. But it is challenging to do more, as outlined on pages 19-24.

The best demand-side and efficiency technologies are presented briefly on page 25, including links to detailed research reports, underlying each theme.

What has changed? The report closes by comparing our latest decarbonization roadmap, in December-2020, with the roadmap we laid out in December-2019. The outlook has improved most for nature-based solutions, efficiency technologies and backing up renewables’ volatility.

How much land is available for reforestation?

Land available for reforestation

2.3bn hectares of land have been deforested, releasing c25% of all anthropogenic emissions. This 19-page note reviews the technical literature, gathers detailed data and concludes 1.2bn hectares can be reforested. Consequently, there is room for 85Mbpd of oil and 400TCF of gas in a decarbonized energy system, while half of all ‘new energies’ technologies are overly expensive and may not be needed in the transition.


Scale matters for nature based solutions to climate change, as the ultimate running room for reforestation will determine how much oil and gas can be permitted in a fully decarbonized energy system; and how many high-cost technologies will be displaced from the abatement curve. These arguments are outline on pages 2-4.

Our models suggest a 15GTpa CO2 sink through reforestation, which is disaggregated on pages 5-6, including detailed data into the CO2 absorption rates of trees. Hence our models require 1.2bn hectares to be reforested.

How are the world’s 15bn hectares of land used? We present detailed data on pages 7-8. Criteria are suggested to prioritize the most effective lands for reforestation.

Degraded lands are the best opportunity for reforestation, as quantified and described on pages 9-10. Our work includes a case study of successful reforestation efforts.

Agriculture is now the largest land use on the planet, but changing habits, policies and technologies could liberate vast areas, as explored on pages 11-13.

Natural non-forests are feasible reforestation candidates, but they are the least preferable, as the goal is to ‘restore nature’, not convert one natural ecosystem into another (page 12).

Urban forests are also of high value, but too small to move the needle (page 13).

Precise bottom-up estimates of reforestation potential are made in the academic literature. Pages 16-18 cover the key studies in the field, and our own impressions on heated debates within the scientific community.

What if we are wrong? Nature is never certain, hence we consider this question on page 19, but we still believe our reforestation estimates are conservative.

Prevailing wind: new opportunities in grid volatility?

UK wind power

UK wind power has almost trebled since 2016. But its output is volatile, now varying between 0-50% of the total grid. Hence this 14-page note assesses the volatility, using granular, hour-by-hour data from 2020. EV charging and smart energy systems screen as the best new opportunities. Gas-fired backups also remain crucial to ensure grid stability. The outlook for grid-scale batteries has actually worsened. Finally, downside risks are quantified for future realized wind power prices.


This rise of renewables in the UK power grid is profiled on page 2, showing how wind has displaced coal and gas to-date.

But wind is volatile, as is shown on page 3, thus the hourly volatility within the UK grid is 2.5x higher than in 2016.

Power prices have debatably increased due to the scale-up of wind, as shown on page 4.

But price volatility measures are mixed, as presented on pages 5-6. We conclude that the latest data actually challenge the case for grid-scale batteries and green hydrogen.

Downside volatility has increased most, as is quantified on pages 7-8, finding a vast acceleration in negative power pricing, particularly in 2020.

The best opportunities are therefore in absorbing excess wind power. EV charging and smart energy systems are shown to be best-placed to benefit, on pages 9-10.

Upside volatility in power prices has not increased yet, but it will do, if gas plants shutter. The challenge is presented on pages 11-13, including comparisons with Californian solar.

Future power prices realized by wind assets are also likely to be lower than the average power prices across the UK grid, as is quantified on page 14. This may be a risk for unsubsidized wind projects, or when contracts for difference have expired.

Geothermal energy: what future in the transition?

Levelized costs of different geothermal energy projects are highest for deep geothermal and lowest for the best hotspots.

Drilling wells and lifting fluids to the surface are core skills in the oil and gas industry. Hence could geothermal be a natural fit in the energy transition? This 17-page note finds next-generation geothermal economics can be very competitive, both for power and heat. Pilot projects are accelerating and new companies are forming. But the greatest challenge is execution, which may give a natural advantage to incumbent oil and gas companies.


The development of the geothermal industry to-date is summarized on pages 2-4. We also explain the rationale for geothermal in the energy transition.

The costs of geothermal projects can be disaggregated across wells (page 5), pumping (page 6-7) and power turbines (pages 8-9). We draw out rules of thumb, to help you understand the energy economics.

The greatest challenge is geological complexity, as argued on page 10. It is crucial to find the best rocks and mitigate execution risks.

Base case economics? Our estimates of marginal costs are presented for traditional geothermal power (page 11), next-generation deep geothermal electricity (page 12) and using geothermal heat directly (page 13).

Leading companies are profiled on pages 14-16, after tabulating 8,000 patents. We also reviewed incumbent suppliers, novel pilots, and earlier-stage companies.

We conclude that geothermal energy is a natural fit for incumbent oil and gas companies to diversify into renewables, and arguably a much better fit than wind and solar (page 17).

Biomass and BECCS: what future in the transition?

Biomass and BECCS

20% of Europe’s renewable electricity currently comes from biomass, mainly wood pellets, burned in facilities such as Drax’s 2.6GW Yorkshire plant. But what are the economics and prospects for biomass power as the energy transition evolves? This 18-page analysis leaves us cautious.


Arguments in favor of biomass are outlined on pages 2-3, using the carbon cycle to show how biomass could be considered zero-carbon in principle.

Examples of biomass power plants are described on pages 4-5, focusing upon Drax and RWE, and drawing upon data from 340 woody biomass facilities in US power.

The economics of producing biomass pellets are presented on pages 6-7, including a detailed description, capex breakdown, and critique of input assumptions.

The economics of burning biomass pellets to generate electricity are presented on pages 8-9, again with a detailed description and critique of input assumptions.

The economics of capturing and disposing of the CO2 are presented on pages 10-12, allowing us to build up a full end-to-end abatement cost for BECCS.

Energy economics are disaggregated on pages 13-14, in order to derive a measure of energy return on energy invested (EROEI) and CO2 intensity (in kg/kWh). Surprisingly, we find the EROEI for BECCS to be negative.

Is it sustainable? We answer this question on 15-17, arguing that biomass energy and BEECS, properly considered, both have a higher CO2 intensity than gas.

Conclusions and implications are presented on pages 18, including bridges for the total CO2 intensity of biomass and BECCS.

Energy transition: is it becoming a bubble?

Energy transition becoming a bubble?

Investment bubbles in history typically take 4-years to build and 2-years to burst, as asset prices rise c815% then collapse by 75%. In the aftermath, finances and reputations are both destroyed. There is now a frightening resemblance between energy transition technologies and prior investment bubbles. This 19-page note aims to pinpoint the risks and help you defray them.


Our rationale for comparing energy transition to prior investment bubbles is contextualized on page 2, based on discussions we have had with investors and companies in 2020.

Half-a-dozen historical bubbles are summarized on pages 3-4, in order to compare the energy transition with features of Dutch tulips, the South Sea and Mississippi Companies, British Railway Mania, Roaring Twenties, Dot Com bubble and sub-prime mortgages.

Five common features of all bubbles are considered in turn on pages 5-16. In each case, we explain how the feature contributed to past bubbles, and where there is evidence of the feature in different energy transition technologies.

Important findings are that many themes of the energy transition can achieve continued deflation or profitability, but not both; while a combination of increasing leverage and curtailment on renewables assets could leave many assets underwater.

Implications are drawn out on pages 17-19, including five recommendations for decision-makers to find opportunities and avoid the most dangerous aspects of bubbles surrounding the energy transition.

Electrolysers: how much deflation ahead for hydrogen?

Electrolyser costs for green hydrogen

For green hydrogen to become competitive, total electrolyser costs must deflate by over 75% from current levels around $1,000/kW. This 14-page note breaks down the numbers and the challenges, based on patents and technical papers. We argue 15-25% total cost deflation may be more realistic if manufacturers also strive to make a margin in the future.


The importance of green hydrogen cost deflation is quantified on pages 2-4, using worked examples from the power industry, trucking industry and by comparison to blue hydrogen.

Total installed costs of hydrogen electrolysers are decomposed on pages 5-7, across forty distinct categories. Cost drivers are also discussed.

Benefits of scale will allow for deflation. But how much? We answer this question (pages 8-9), by comparison to deflation in other technologies.

Beware false prophets. Our review of 50 patents shows that some headline cost deflation may come at the cost of lower efficiency, resiliency, longevity or safety (pages 10-11).

Technology leaders are profiled on pages 12-14 after looking across 13,600 patents globally.

Decarbonization in Europe: but is there enough gas?

is there enough gas to decarbonize Europe?

A lack of gas is likely to slow down Europe’s energy transition in the 2020s. This is the conclusion in our new 12-page note, which captures basic policy objectives, such as phasing out 50% of Europe’s coal, electrifying 20% of its vehicles, cleaning up 25% of its shipping and shifting 3% of its energy into low carbon hydrogen. To achieve this, an incremental 85MTpa of LNG must be sourced by 2030, absorbing one third of new global LNG supplies, and stoking mid-2020s LNG shortages.


Policy tilts in Europe are summarized on pages 2-3, including renewables, coal phase outs, nuclear phase-down, electric transport, broader electrification, industrial efficiency, hydrogen and oil and gas exploration.

The impacts on power markets are modelled on page 4, showing how demand will rise at c1% per year, plus the relative growth rates of renewables and gas.

The impacts on gas markets are modelled on pages 5-6, showing that Europe’s reliance on imports will rise from c50% in 2000 to over 90% in 2030.

LNG imports must therefore increase rapidly, as argued on page 7. We put Europe’s incremental demands into context against the broader LNG market.

Sensitivities are explored on pages 8-11. Across half-a-dozen of the policy tilts that we considered, a shortage of gas will be the major bottleneck.

Implications are discussed on page 12. Gas and LNG prices may need to rise sharply in the mid-2020s and/or the policy objectives discussed in this note may need to be walked back.

Planting a seed: will new forests disrupt new energies?

How to plant trees to offset CO2 at low cost

Tree planting charities are emerging as the best means to offset CO2. They will displace other ‘new energies’ from the cost curve. Abatement costs are $3-10/ton. The solution is available today. It also restores nature. This 18-page note presents the numbers, the advantages, pushbacks, implications, and profiles some of the charities we have supported.


The importance of nature-based CO2 offsets in a fully decarbonized energy mix is outlined on pages 2-3.

But how do you get the most bang for your buck? We have evaluated thirty providers of CO2 offsets and answer this question on pages 4-7.

The costs and CO2 uptake rates from tree planting are spelled out on pages 5-6.

A checklist of seven criteria is presented on page 8, to help you maximize your impact, when contributing to nature-based projects.

The advantages of tree planting are argued on page 9, covering costs, technical readiness, simplicity and additional virtues.

The drawbacks are allayed on pages 10-11, tabulating the ‘top ten’ criticisms of nature based solutions, and how we would mitigate these concerns.

Controversially, we have concluded that ‘certified’ carbon credits deliver less value for money than tree planting. We outline why on pages 12-13.

Implications for companies and investors are set out on page 14, including examples of corporations that have chosen nature based solutions over expensive new energies.

Three providers of carbon credits are profiled on pages 15-18, including the due diligence we have conducted on each organization, prior to making contributions.

Patent review: six ways to gain an edge?

economic opportunities in the energy transition

Our research identifies economic opportunities in the energy transition. To do this, we have now drawn upon 20M patents. This 14-page note illustrates the six ways that patent analysis can give decision-makers an edge. It includes detailed examples in renewables, electric vehicles, capital goods, conventional energy and hydrogen.


The objective of our research is to find economic opportunities that can drive the energy transition. This note outlines how patents feature in our research and why they matter.

What are patents? A brief history and overview of patent filings is given on pages 2-3.

Charting challenges? By definition, patents must explain the precise technical challenges that they aim to overcome. Page 4 illustrates the point, presenting our top conclusions from reviewing 100 patents into lithium ion batteries for electric vehicles.

Gauging the pace of innovation? The average energy technology sees 600 patents filed per year and has been accelerating at a 5% CAGR. It is exciting when progress accelerates and somewhat less promising it slows. Different themes are ranked on pages 5-6.

Competitive pressure? China now files 70% of all global patents, the largest share of any country in history. Some sectors are also intensively competitive. Pages 7-8 explain how we help to flag these risks.

Finding moats? To generate superior returns, it is necessary to have superior technologies. Pages 9-10 show how patent filings correlate with ROACEs and costs. Technology leaders in the conventional energy industry are ranked on page 11.

Company snapshots? We give two examples on page 12-13, assessing how Tesla and Vestas’s technical edge stacks up against peers’.

Avoid bubbles? Sometimes the emperor has no clothes, and companies’ promises are unrealistic. It shows up in their lack of IP. For example, earlier this year, we questioned Nikola’s hydrogen truck patents, as is recapitulated on page 14.

We aim to help our clients avoid the bubbles and find non-obvious opportunities that can earn returns and drive the transition forwards. Please let us know if we can help you.

Copyright: Thunder Said Energy, 2019-2024.