Deep blue: cracking the code of carbon capture?

blue hydrogen carbon capture

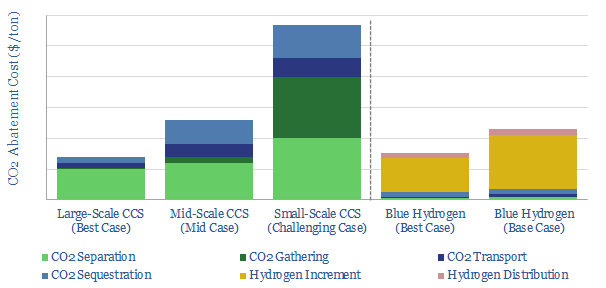
Carbon capture is cursed by colossal costs at small scale. But blue hydrogen may be its saviour. Crucial economies of scale are guaranteed by deploying both technologies together. The combination is a dream scenario for gas producers. This 22-page note outlines the opportunity and costs.


The mechanics of carbon capture and storage projects are explained on pages 2-4, assessing the costs of CO2 capture, CO2 transport and CO2 disposal in turn.

However CCS faces challenges, which are outlined on pages 4-5. In particular, CO2 has three ‘curses’ at small scale, which dramatically inflate the costs.

We quantify the three curses’ impacts. They are diffuse CO2 concentrations (pages 6-8), high fixed costs for pipelines and disposal facilities (pages 8-10) and difficulties gathering CO2 from dispersed turbines and boilers (pages 10-11).

The rationale for blue hydrogen is to overcome these challenges with CCS, as explained on page 12.

Different blue hydrogen reactor designs are discussed, and their economics are modelled on pages 13-15. Autothermal reforming should take precedence over steam methane reforming as part of the energy transition.

Midstream challenges remain. But we find they are less challenging for blue hydrogen than for green hydrogen on page 16.

A scale-up of blue hydrogen is a dream scenario for the gas industry. The three benefits are superior volumes, pricing power and acceptance in the energy transition, as explained on pages 17-19.

Leading projects are profiled on page 20, which aim to combine blue hydrogen with CCS.

Leading companies in auto-thermal reforming (ATR) are profiled on page 21, based on reviewing technical papers and over 750 patents.

Aker Carbon Capture’s technology is profiled on page 22. Patents reveal a technical breakthrough, but it will only benefit indirectly from our blue hydrogen theme.

A new case for gas: what if renewables get overbuilt?

consequence of overbuilding renewables

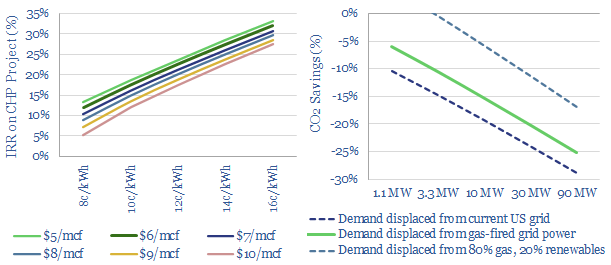
Overbuilding renewables may have unintended consequences, making power grids more expensive and less reliable. Hence more businesses may choose to generate their own power behind the meter, installing combined heat and power systems fuelled by natural gas. Modelled IRRs already reach 20-30%. Capturing waste heat also boosts efficiency to 70-80%, which can be 2x higher than grid power, lowering total CO2 by 6-30%. This 17-page note outlines the opportunity and who might benefit.


Overbuilding renewables could make grids more expensive and less reliable. The mechanics of this challenge are modelled out and explained on pages 2-9.

Expensive and unreliable grids have historically been the main motivator for installing combined heat and power systems behind the meter. The theory, technical details and rationale for these CHP systems are explained on pages 10-11.

Economics of combined heat and power and reviewed in detail on pages 12-14, focusing upon IRRs and their sensitivity to input variables.

Examples of CHP installations are presented on page 15, to identify details and characteristics of prior projects.

Companies that may benefit from the theme are discussed on pages 16-17. They range from mega-cap turbine manufacturers to small-cap stocks and private companies with novel technologies.

Low-carbon refining: insane in the membrane?

Using membranes to fractionate crude oil in refining

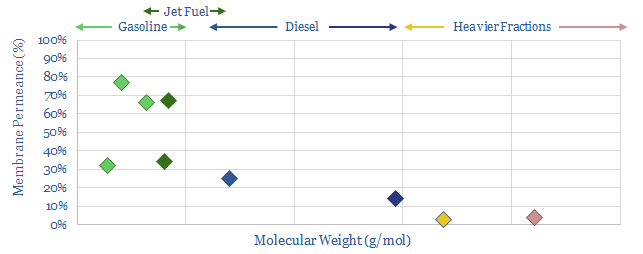
Almost 1% of global CO2 comes from distillation to separate crude oil fractions at refineries. An alternative is to separate these fractions using precisely engineered polymer membranes, eliminating 50-80% of the costs and 97% of the CO2. We reviewed 1,000 patents, including a major breakthrough in 2020, which takes the technology to TRL5. Refinery membranes also comprise the bottom of the hydrogen cost curve. This 14-page note presents the opportunity and leading companies.


The CO2 intensity of refining and the need for economic decarbonization of the sector are quantified on pages 2-4. The discussion focuses upon the CO2 intensity of distillation, including the thermodynamics and costs.

The opportunity to use membranes in lieu of conventional distillation is presented on pages 5-6. We draw on economic models to present respective costs and CO2 intensities of membrane processes.

Hence we screened 1,000 patents to identify leading companies exploring refinery membranes. The findings are presented on pages 7-8. There are three key reasons why the technology has been slow to gain traction.

The most active patent filer in refinery membranes is profiled on page 9, a publicly listed conglomerate with headquarters in the US.

ExxonMobil has made a breakthrough in 2020, deriving permeate streams from a synthetic polymer membrane that resemble the output from a distillation column. We have reviewed the technical disclosures on pages 10-13, highlighting the commercial opportunity and remaining challenges.

Membranes can also unlock the lowest cost hydrogen in the world, recovering hydrogen that is currently wasted or purged in the effluent streams from refinery units. An industry leading example of this technology is explored on page 14.

Great white whales: what happened to whale oil prices?

Great white whale oil

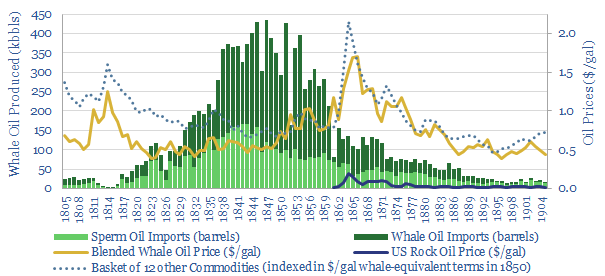
Whale oil was a dominant, albeit barbaric, lighting fuel in the 19th century. But what happened to whale oil prices as the industry was disrupted by kerosene and ultimately by electric lighting? We find whale oil prices maintained a 25x premium to rock oil and outperformed other commodities as the whale oil market collapsed. As whaling declined, the prices of by-products (e.g. whale bone) also rallied very sharply. This 8-page note presents our analysis of the whaling industry from 1805 to 1905 and draws implications for the future of the oil and gas industry.


The US whaling fleet peaked at 233k tons in 1846, with 680 ships, 34 brigs and 22 schooners. Capacity remained at a plateau of 200kt until 1859, producing an average of 930bpd of whale oil over this timeframe, predominantly for lighting.

Then the whale oil industry was disrupted, and by 1880, rock oil volumes were 70x larger than whale oil volumes, while by 1902, the US had 18M electric lightbulbs.

The rise and fall of the whale oil industry is put into its historical context on pages 2-3, including data on the industry’s productivity and the timing of its disruption.

The relative pricing performance of whale oil is discussed on pages 4-5, in comparison to rock oil and a basket of long-term commodity prices.

A very important driver of whale oil pricing dynamics was that supply peaked before demand, and the report assesses the productivity of the whaling industry over time.

A rally in whale bone prices (a by-product of whaling) and the premiumization of whale oil supplies were also side-effects of whale oil being disrupted, as detailed on pages 6-7.

Implications for the oil and gas industry are presented on page 8, as the historical analogy shows prices could rise sharply if future oil supply falls faster than future oil demand.

Side-products such as lubricants, plastics and jet fuel could rally if electric vehicles and wind/solar disrupt core oil and gas markets.

The full database underlying our analysis is available for download here. Our long term oil demand model is linked here.

The great leveler: why CO2 prices are crucial?

CO2 price for decarbonization

Energy policies currently act as kingmakers for a select few transition technologies. But they offer no incentives for other, lower cost and more practical alternatives, which could economically decarbonize the whole world by 2050. Hence this 14-page note presents the top five arguments for a simple, transparent, economy-wide CO2 price for decarbonization and energy transition. We also illustrate who would benefit versus which bubbles may burst.


The need for a level playing field in the energy transition is outlined on pages 2-4. Current policies are overly complex, arbitrary and may even stifle progress.

New technologies would emerge with a CO2 price, as energy transition broadens across every sector. Examples are presented on pages 5-8.

CO2 prices accelerate the pace of progress, as shown on pages 9-11. This matters as past energy transitions took 70-100 years and a faster transition is needed today.

CO2 prices unlock the most economic transition, as the lowest-cost technologies can compete. Pages 12-13 quantify the importance of economics.

CO2 prices can work, as shown on page 13-14. We model that a CO2 price of $40-75/ton can decarbonize the entire United States by 2050, while also unlocking $3.5trn new investment and creating 500,000 new jobs.

The top five arguments for a CO2 price for decarbonization of the world by 2050, and who would benefit versus which bubbles may burst, are highlighted in the article sent out to our distribution list here.

US Shale: the second coming?

Future US shale productivity

Future US shale productivity can still rise at a 5% CAGR to 2025, based on evaluating 300 technical papers from 2020. The latest improvements are discussed in this 12-page note, and may spark more productivity gains than any prior year. Thus unconventionals could grow by 2.6Mbpd per annum from 2022-25 to quench deeply under-supplied oil markets. But hurdles remain. The leading technologies are also becoming concentrated in the hands of fewer operators and an emerging group of oil services.


Our production forecasts for US shale are outlined on pages 2-3. Volumes must double by 2025 to rebalance future oil markets, which hinges on productivity gains.

Our outlook for shale productivity is explained on page 4, including our methodology, which considers the pace of progress in technical papers.

Headline comparisons are presented on pages 5-6, between the technical papers filed around the shale industry in 2018, 2019 and 2020.

The latest improvements are summarized across each category, drawing on the most interesting technical papers and the companies that have filed them. This includes petrophysics (page 7), completion designs (page 8), optimizing completion fluids (page 8), Shale-EOR (page 9) and a step-change in machine learning algorithms (page 10-11).

The leading companies are highlighted on page 12, ranked according to the numbers of technical papers they have filed in each year. Some are stepping up, and gaining an edge, while others are clearly pulling back on shale R&D.

Technology transitions: thinking fast and slow?

Pace of adoption for energy transition technologies

It takes 15-100 years for a major new technology to ramp from 10% to 90% of its peak adoption rate. But what determines technology adoption rates? This 15-page note finds answers by evaluating 20 examples that changed the world from 1870 to 2020. We derive four rules of thumb, in order to quantify the pace at which different energy transition technologies will scale up.


Technology adoption rates matter both for meeting climate goals around the energy transition and for investors trying to forecast future market sizes, as argued on pages 2-3.

But how can we measure adoption rates? Our methodology is explained on pages 4-6, aggregating data on the adoption rates of twenty technologies that changed the world from 1870-2020.

Infrastructure requirements are the greatest determinant of a technology’s ascent, impacting adoption rates by a factor of 2-3x, as outlined on pages 7-8.

Transformational technologies that improve consumers’ lives are also adopted c2x faster than non-transformational ones, all else equal, as quantified on pages 9-10.

Adoption rates stall when economics are challenged, slowing down by as much as 5-7x, as measured on pages 10-12.

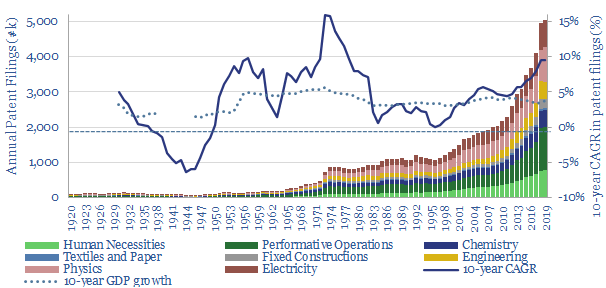
Technology adoption rates also appear to be speeding up, occurring 1% per year faster in recent decades compared with the early 20th century, as shown on page 13. This squares with a record pace of global patent filings and the way AI enables technology gains.

What does it mean for energy transition technologies? On pages 14-15, we use our insights to forecast the adoption rates for various energy transition technologies.

A general finding in our broader energy transition research has been that new technologies take longer to reach maturity than might intuitively be expected (note here) and in our view, markets often over-value new technologies and under-value incumbents (note here).

Backstopping renewables: cold storage beats battery storage?

Phase change materials for backstopping renewables

Phase change materials could be a game-changer for energy storage. They absorb (and release) coldness when they freeze (and melt). They can earn double digit IRRs unlocking c20% efficiency gains in freezers and refrigerators, which make up 9% of US electricity. This is superior to batteries which add costs and incur 8-30% efficiency losses. We review 5,800 patents and identify early-stage companies geared to the theme in our new 14-page note.


Refrigerators and freezers comprise 9% of the US electric grid, of which half is in the commercial sector, across 4,200 warehouses, 40,000 supermarkets and 620,000 restaurants. This report argues that a new class of materials, Phase Change Materials (PCMs), can effectively store excess renewable energy as coldness in these fridges and freezers (aka “demand shifting“), improving their efficiency by c20% and without requiring power prices to increase.

The energy economics of cold storage are explained on pages 2-4, outlining the energy consumption of cold storage facilities as function of different input variables (which will also help you understand how to save energy at your fridge-freezer at home) .

Phase change materials are explained on pages 5-6, explaining what they are, how they work, and how they can lower energy consumption by c20% at a typical fridge/freezer.

The economics are modelled on pages 7-8, showing an 8.5% IRR under recent costs and power prices, rising into double digits with a CO2 price, and above 30% with recent deflation in the costs of PCMs.

A comparison with battery storage is provided on page 9-10, showing a clear preference for PCMs. Batteries decrease efficiency and raise electricity costs. PCMs increase efficiency and do not raise electricity costs. Batteries have further challenges.

Who are the leading companies commercialising PCMs? We answer this question on pages 11-14, by reviewing 5,800 patents. We find promising venture-stage and growth-stage companies in the space, plus listed companies in the capital goods, materials and automotive sectors.

Hydrogen: lost in transportation?

Costs of hydrogen transportation

Transporting hydrogen will be more challenging than for any other commodity ever commercialised in the history of global energy. This 19-page note reviews the costs and complexities of cryogenic trucks, hydrogen pipelines and chemical hydrogen carriers (e.g., ammonia). Midstream costs will be 2-10x higher than comparable gas value chains, while up to 50% of hydrogenโ€™s embedded energy may be lost in transportation.


We have assessed the costs of green hydrogen value chains in our prior research, focusing on power and trucking. The costs are re-capped on pages 2-3. But our calculations assume all hydrogen is generated near its point of sale. This note assesses the additional costs and complexities of hydrogen transport.

Hydrogen is inherently more complex to transport than natural gas, due to immutable physical and chemical differences, which are spelled out on pages 4-5.

Cryogenic trucks are assessed on pages 6-7. Liquefying hydrogen at -253C and the associated boil-off may consume c50% as much energy as is in the delivered hydrogen.

New hydrogen pipelines are assessed on pages 8-12, including a deep-dive into the fluid mechanics. Costs will inherently be 2-10x higher than for natural gas.

Blending hydrogen into pre-existing gas pipelines is assessed on pages 13-14. This option introduces unfathomable complexity for a mere 3-6% CO2 reduction.

Chemical carriers such as ammonia are assessed on pages 15-17. We model the value chain end-to-end, which makes for interesting conclusions on Air Products’s recently sanctioned $7bn hydrogen-ammonia project in Saudi Arabia.

The impact on hydrogen costs is quantified on pages 18-19. We conclude hydrogen transport would increase our power and trucking costs by c10-25%.

Turning the tide: is another offshore cycle brewing?

New Offshore Cycle

Oil markets look primed for a new up-cycle by 2022, which could culminate in Brent surpassing $80/bbl. This is sufficient to unlock 20% IRRs on the next generation of offshore projects, and thus excite another cycle of offshore exploration and development. Beneficiaries include technology leaders among offshore producers, subsea services, plus more operationally levered offshore oil services. The idea is laid out in our 17-page note.


Our oil market outlook is detailed on pages 2-5, seeing 2Mbpd of under-supply by 2022 and a potential inventory draw of 2.5bn bbls.

>$80/bbl oil prices are needed to instigate a new offshore cycle, as modelled and explained on pages 6-9.

Can’t the next oil cycle be quenched purely by ramping up short-cycle shale, instead of another offshore cycle? We answer this pushback on pages 10-11.

Is another offshore cycle compatible with the energy transition and global decarbonization? We answer this pushback on pages 12-13, with detailed data on CO2 emissions per barrel offshore versus elsewhere.

Who benefits? We present the technology leaders among producers, service companies and emerging technologies on pages 14-17, drawing on our prior patent screens and technical research.

Copyright: Thunder Said Energy, 2019-2024.