Search results for: “shale”
-
US shale: outlook and forecasts?
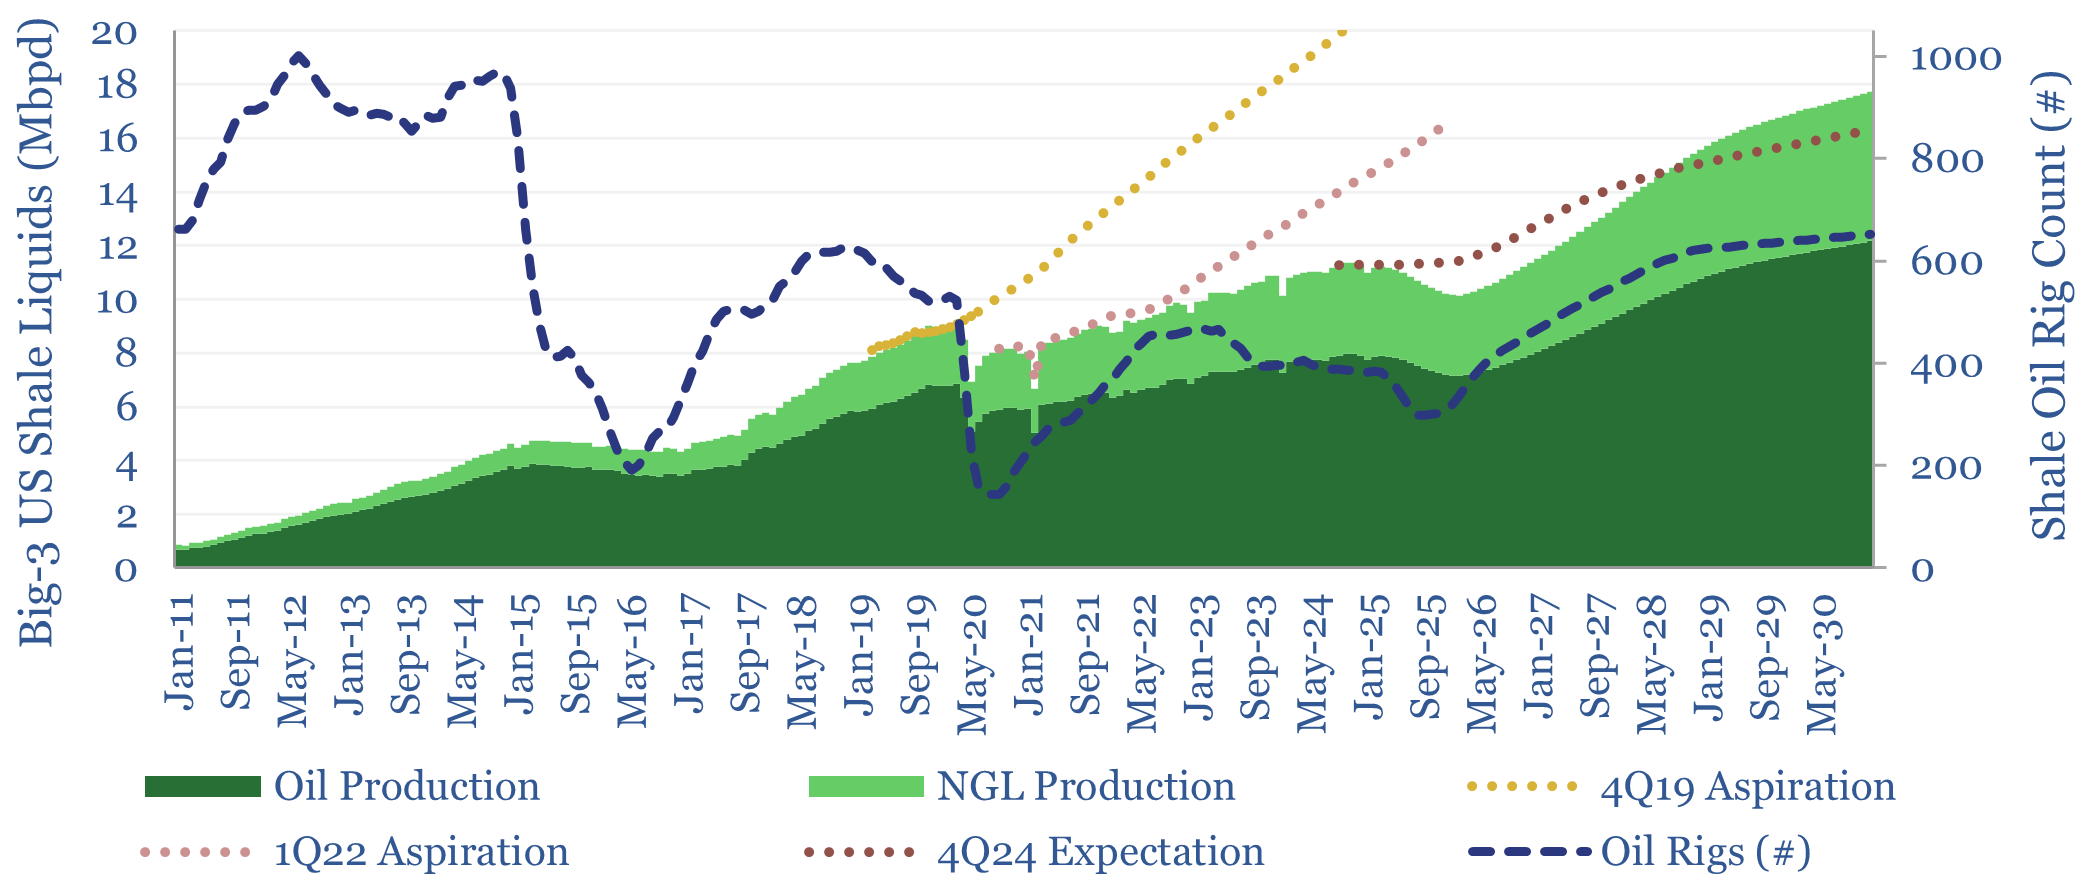
This model sets out our US shale production forecasts by basin. It covers the Permian, Bakken, Eagle Ford, Marcellus/Utica and Haynesville, as a function of the rig count, drilling productivity, completion rates, well productivity and type curves. The data-file was last updated in May-2025, revising liquids growth negative in 2025-26, which in turn tightens US…
-
European shale: an overview?
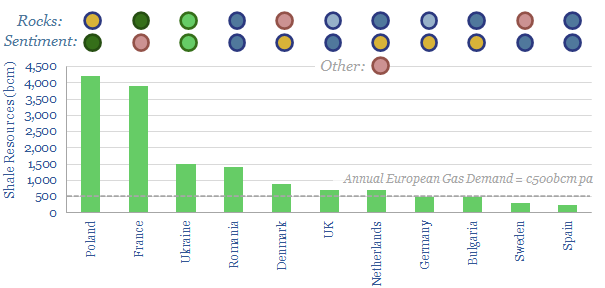
Europe has 15 TCM of technically recoverable shale gas resources. This data-file aims to provide a helpful overview, as we expect exploration to re-accelerate. Ukraine has the best shale in Europe, which may even be a motivation for Russian aggression. Other countries with good potential, held back only by sentiment are Romania, Germany, UK, Bulgaria…
-
US shale gas: the economics?
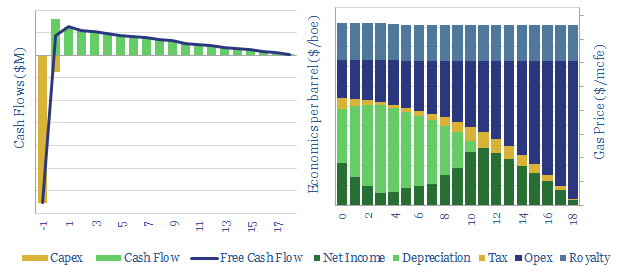
This data-file breaks down the economics of US shale gas, in order to calculate the NPVs, IRRs and gas price breakevens. There is a perception that the US has an infinite supply of gas at $2/mcf, but rising hurdle rates and regulatory risk may require higher prices.
-
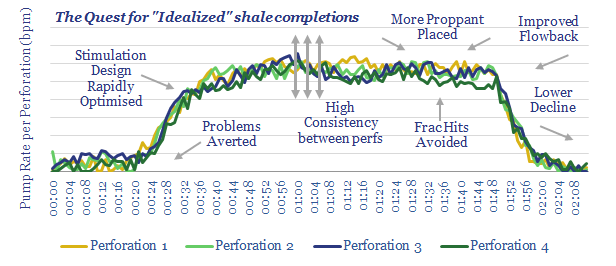
CO2 intensity of shale: breakdown by category?
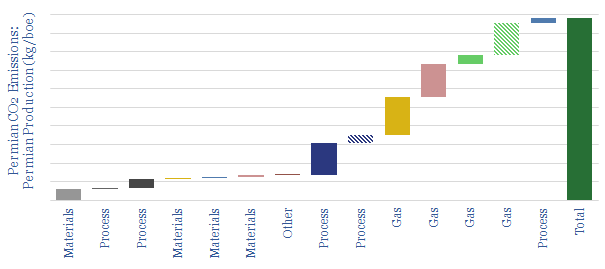
This model disaggregates the CO2 emissions of producing shale oil, across 14 different contributors: such as materials, drilling, fracturing, supply chain, lifting, processing, methane leaks and flaring. CO2 intensity can be flexed by changing the input assumptions. Our ‘idealized shale’ scenario follows in a separate tab, showing how Permian shale production could become ‘carbon neutral’.
-
Shale water costs: transport, treatment and disposal?
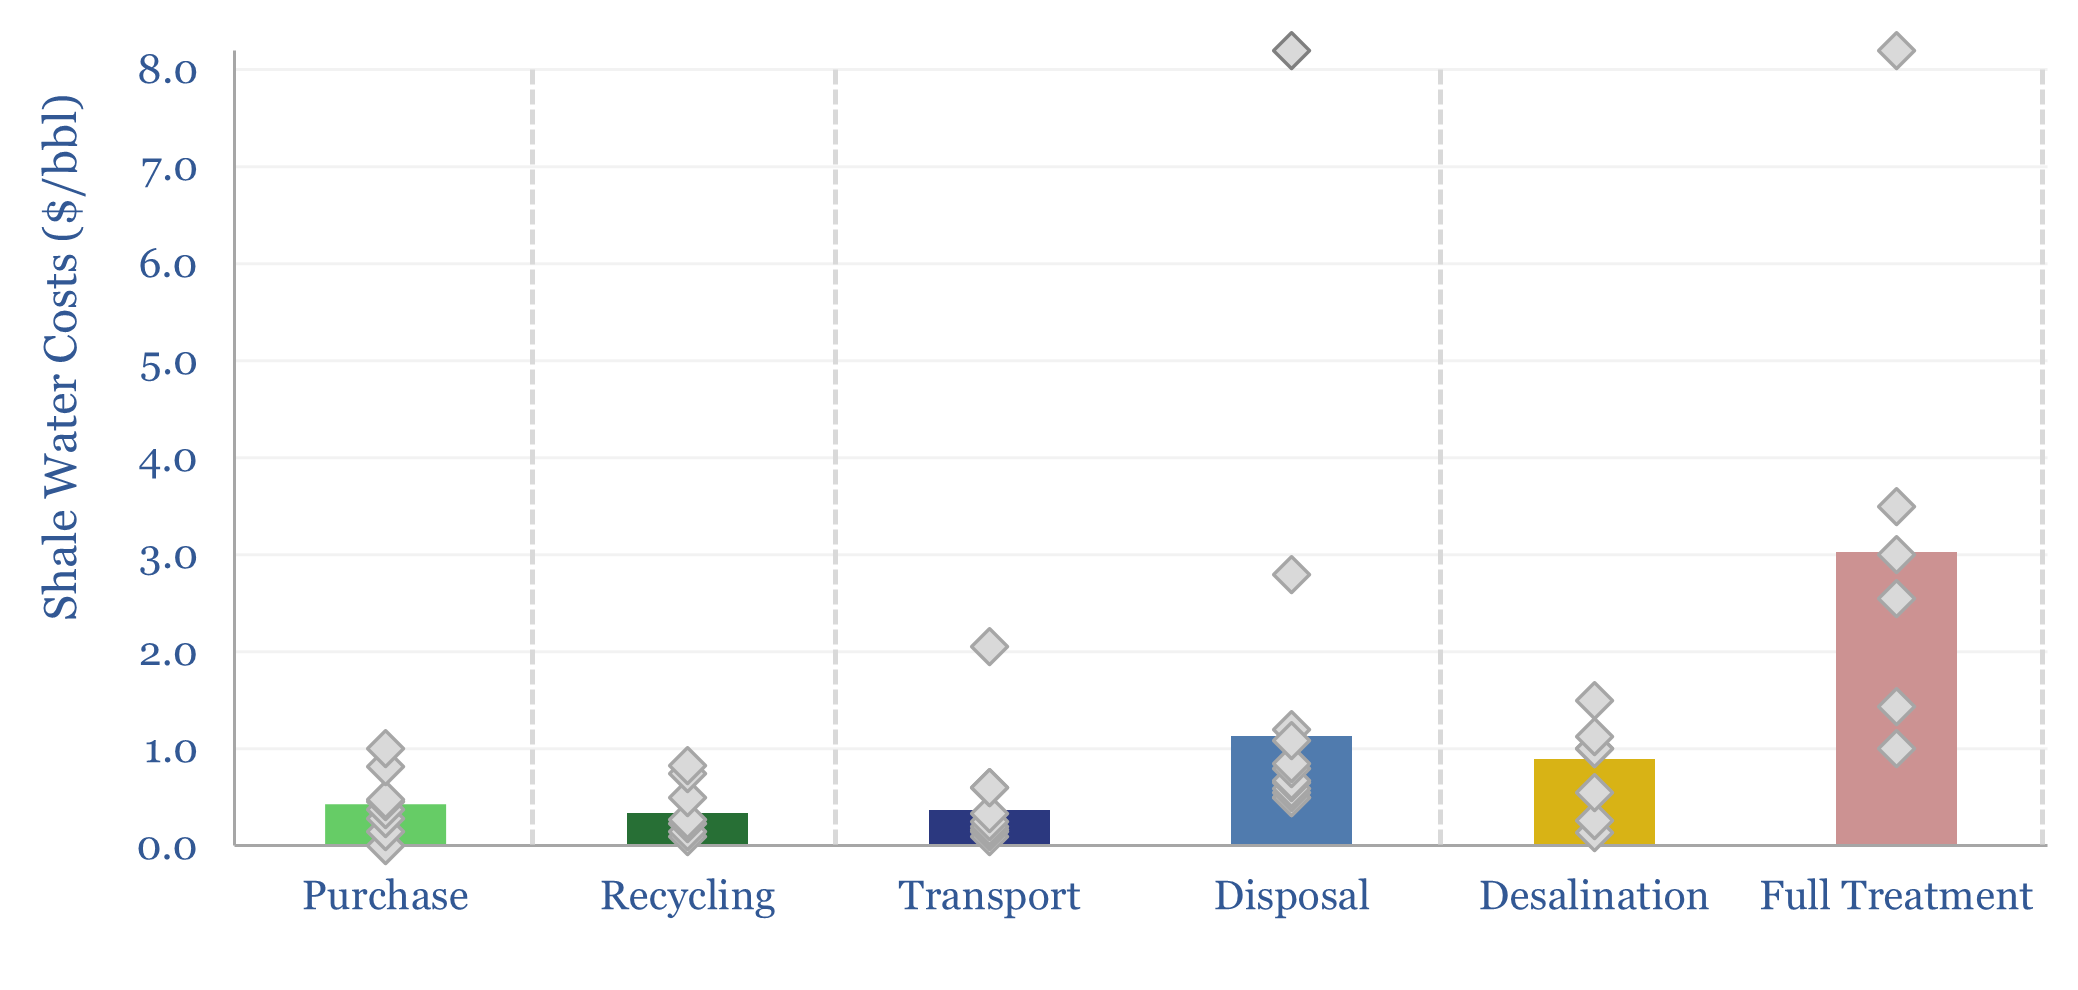
Shale water costs might average $0.3/bbl for filtering and recycling, $0.4/bbl to procure new water, $1/bbl for disposal and $3/bbl for full treatment back to agricultural/cooling-quality water. There is variability in water properties and throughout shale basins. This data-file aggregates disclosures into shale water costs.
-
Explaining Shale: Can Machine Learning Capture Complexity?
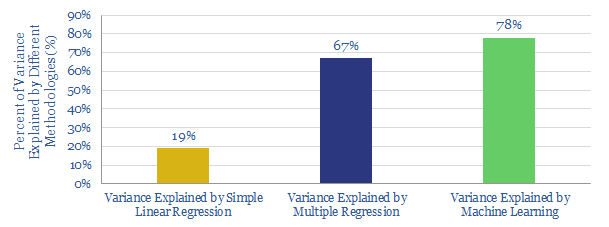
Machine learning predicts 78% of the variance in shale well productivity, suggesting $1M/well savings and 19-97% resource uplifts. This data-file presents the correlation matrix between 22 inter-related variables which co-vary with well productivity. The complexity requires “big data” approaches. We see upside from Machine Learning in shale.
-
Shale: Upgrade to Fiber?
This note focuses on the most exciting new data methodology we have seen across the entire shale space: distributed acoustic sensing (DAS) using fiber-optic cables. It has now reached critical mass.
-
China’s Shale Challenge?
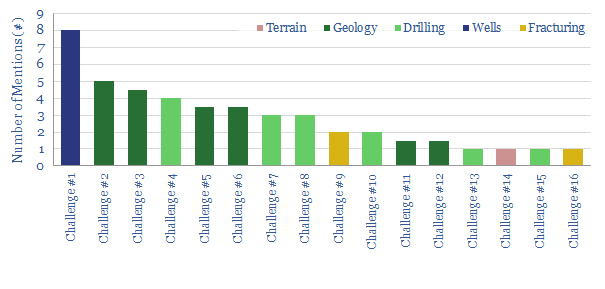
This data-file quantifies the most-discussed challenges for developing Chinese shale gas, after a review of the technical literature, as well as the solutions suggested to combat them, and our “top ten conclusions” on Chinese shale.
-
Chevron: SuperMajor Shale in 2020?
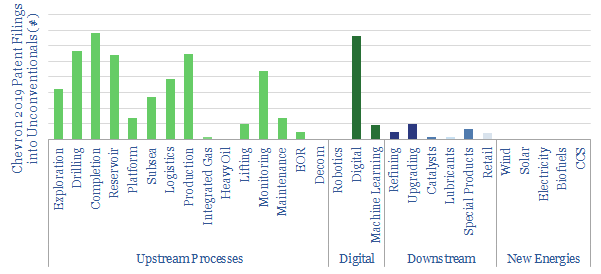
SuperMajors’ shale developments are assumed to differ from E&Ps’ mainly in their scale and access to capital. Access to superior technologies is rarely discussed. But new evidence is emerging. This note assesses 40 of Chevron’s shale patents from 2019, showing a vast array of data-driven technologies, to optimize every aspect of shale.
-
US shale: the economics?
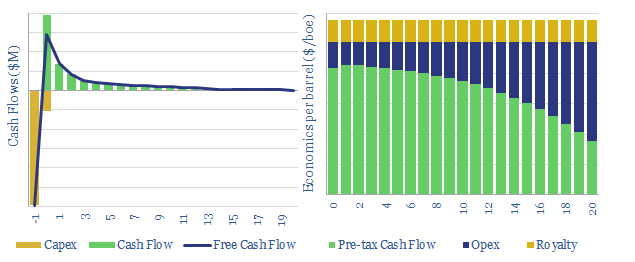
This model breaks down the economics of US shale, including a granular build-up of capex costs across 18 different categories. Our base case requires a $40/bbl oil price for a 10% IRR at a $7.0M shale well with a 1.0 kboed IP30. Economics range from $35-50/bbl. They are most sensitive to productivity.
Content by Category
- Batteries (89)
- Biofuels (44)
- Carbon Intensity (49)
- CCS (63)
- CO2 Removals (9)
- Coal (38)
- Company Diligence (94)
- Data Models (838)
- Decarbonization (160)
- Demand (110)
- Digital (59)
- Downstream (44)
- Economic Model (204)
- Energy Efficiency (75)
- Hydrogen (63)
- Industry Data (279)
- LNG (48)
- Materials (82)
- Metals (80)
- Midstream (43)
- Natural Gas (148)
- Nature (76)
- Nuclear (23)
- Oil (164)
- Patents (38)
- Plastics (44)
- Power Grids (130)
- Renewables (149)
- Screen (117)
- Semiconductors (32)
- Shale (51)
- Solar (68)
- Supply-Demand (45)
- Vehicles (90)
- Wind (44)
- Written Research (354)