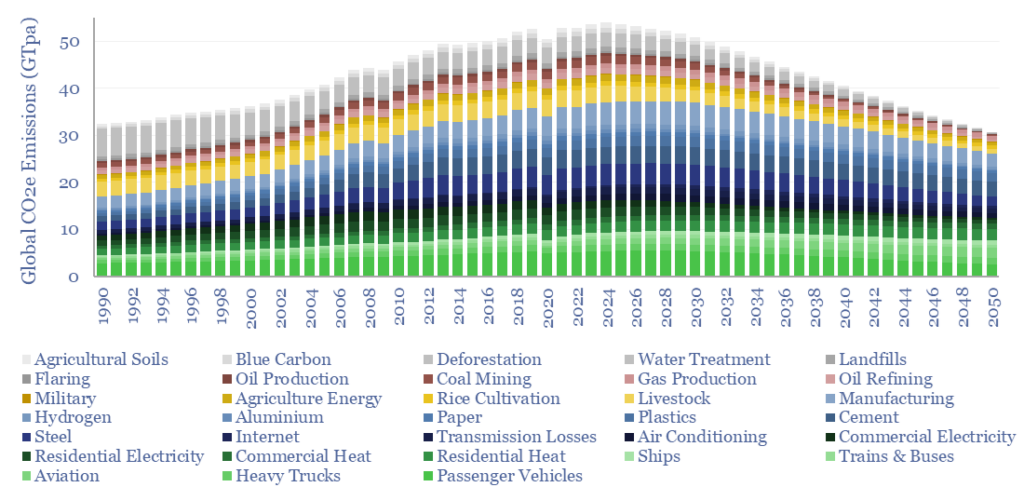
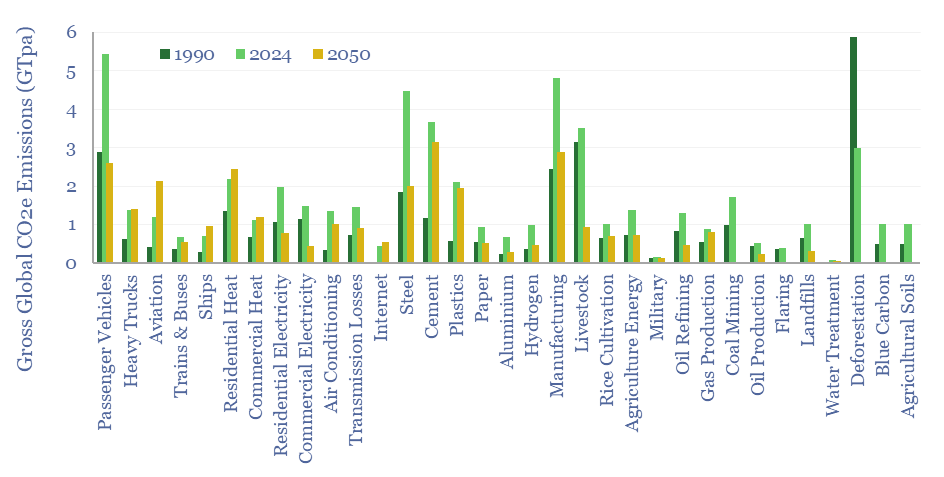
Global CO2 emissions rose from 32GTpa of CO2-equivalents in 1990 to 54GTpa in 2024, and are seen optimistically declining to 30GTpa by 2050, on a gross basis. This global CO2 emissions breakdown covers 33 sources that each explain over 0.5% of global CO2e emissions, as a way of tracking emissions by source, by year, and our projections in the energy transition.
It has taken us six years to get to the point where we can forecast total global CO2e emissions, source by source, and year by year to 2050, drawing upon all of our broader supply-demand models.

Today’s gross global emissions are around 54GTpa of CO2-equivalents. About 40GTpa comes from the combustion of hydrocarbons, which releases CO2. This does not take place in some satanic ritual, at a single big furnace, but across 33 separate line items, most of which are providing products that people want or need.
In our roadmaps to net zero, CO2 from electricity falls from 16GTpa to 10GTpa, as the CO2 intensity of the global grid falls -70%, to 0.15 kg/kWh, but electricity use grows 2.3x. This requires solar and wind output to ramp 15x and 5x, to 25,000 and 11,000 TWH pa by 2050.
5GTpa of emissions from deforestation, land use change and environmental changes are optimistically assumed to fall to nil by 2050. This is a huge line in global CO2 balances, which is too often overlooked.
8GTpa of CO2e from methane is halved. It is useful to capture 75% of the 25bcfd of methane emitted by livestock and landfills as biogas.
Materials value chains must all generally get 25-50% more efficient, so they use less energy, even as their underlying demand grows by 10-90%, especially the largest materials value chains, by emissions which are steel, cement, plastics, paper and aluminium. This is via greater recycling, electrification of heat, and maybe helped by AI?
Five value chains are still seen emitting 1.5GTpa more CO2 in 2050 than today: Trucks, aviation and shipping have no cost-effective decarbonization pathways, while residential and commercial heat are swamped by EM growth.
The data-file contains our backup workings, and further data placing global CO2 emissions (in million tons per annum) in context with 25 other production industries globally.
The CO2 intensity of different materials was previously aggregated in this data-file, but as our list of covered materials has progressively grown larger and larger, we are now tracking the CO2 intensity of materials in a separate data-file here.
