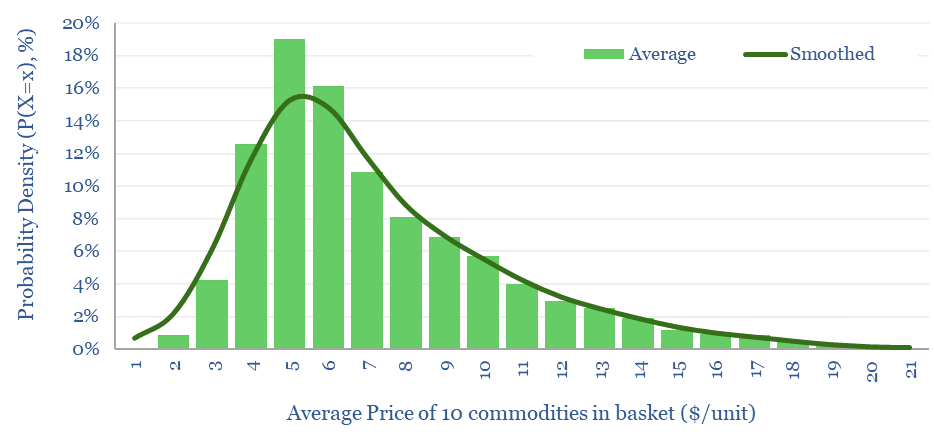
Commodity price volatility tends to be lognormally distributed, based on the data from twelve commodities, over the past 50-years. Means are 20% higher than medians. Skew factors average +1.5x. Standard errors average 50%, while more volatile prices have more upside skew.
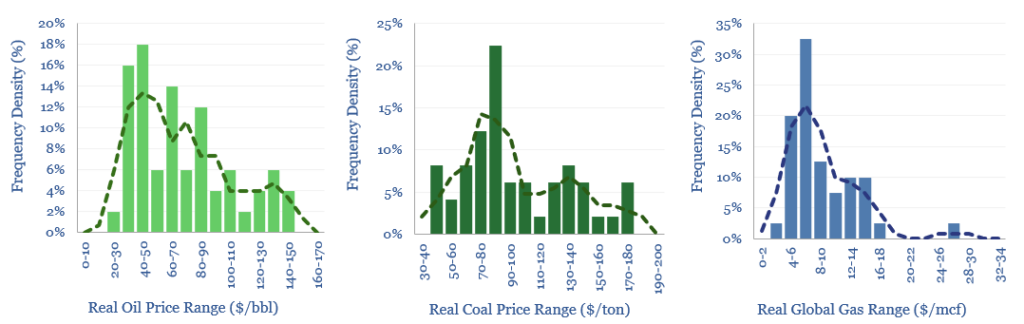
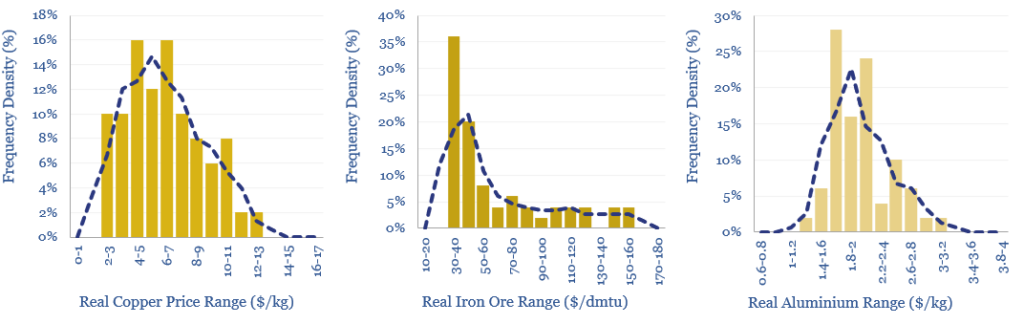
This data-file contains data plotting the statistical distributions of volatility for twelve major commodities, ranging across energy commodities such as oil, gas and coal; industrial metals such as iron ore, copper and aluminium; precious metals such as gold and silver; and agricultural commodities such as sugar, soybeans and palm oil.
Commodity price volatility tends to be lognormally distributed, based on starting with the charts shown below, then smoothing all of these statistical distributions together, for the title chart shown above. This statistical distribution is intuitive, as prices are effectively uncapped to the upside during commodity shocks, but they are effectively capped to the downside, as commodities cannot sustainedly trade below zero.
A fascinating finding is that when commodities are more volatile overall (e.g., as indexed by standard error) then this is 75% correlated with skew in the commodity, or in other words, the mean tends to run further above the median. In other words, this is another indicator that commodities illustrate more upside volatility than downside volatility.
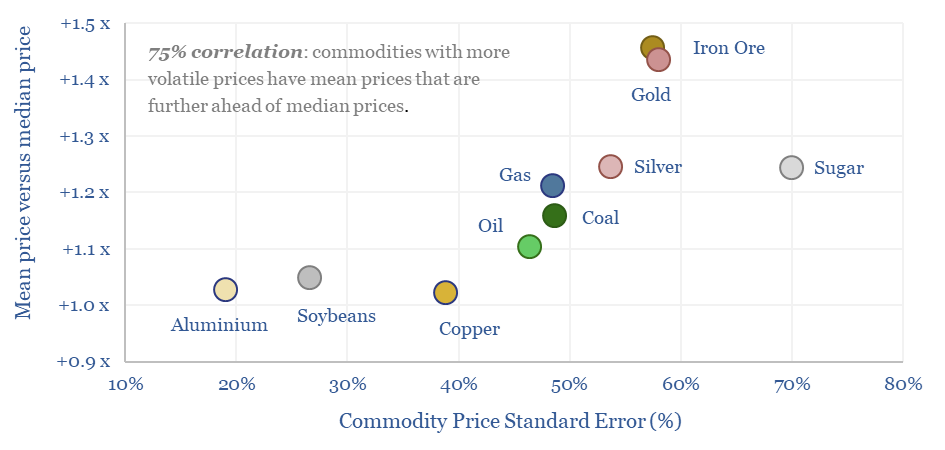
If base case forecasts are thought of as the median price levels of commodities (e.g., $65/bbl for oil over the past 50-years, $8/mcf for global gas, etc), then the data imply that mean average prices will tend to run 1.1 – 1.5x above median expectations.
The final two tabs of the data-file model the lognormal volatility of commodities, illustrating how the value of commodity marketing and trading is likely to rise during the energy transition, as volatility grows on an absolute basis, but also inter-regional volatility is growing due to the ascent of renewables such as wind, solar and hydro.
Fantastic underlying data that helped to build this data-file came from the World Bank pink sheets, which we recommend to anyone looking for free monthly or annual commodity price data.
For more recent and more detailed pricing across a wider range of commodities, please see our commodity price database, for time series that go further back in time to the 1800s, please see our database of very long-term commodity prices, while we also have analysis into the performance of commodities during conflicts and performance of commodities during recessions.