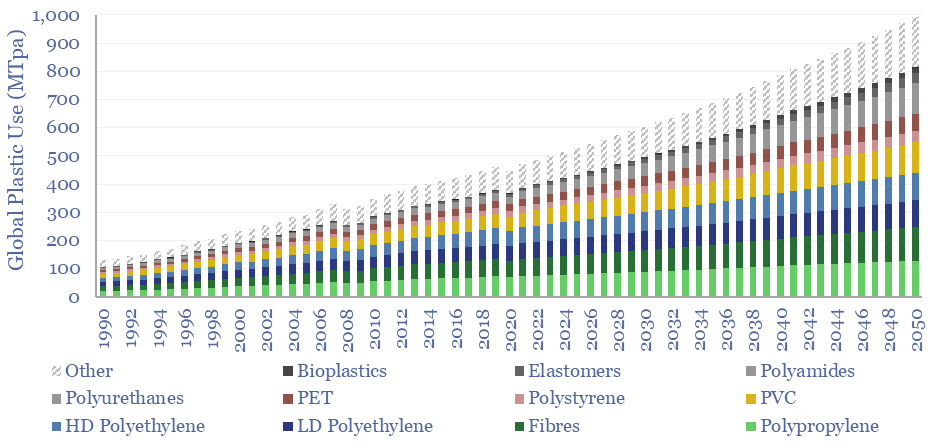
Global plastic is estimated at 470MTpa in 2022, rising to 1,000MTpa by 2050. This data-file is a breakdown of global plastic demand, by product, by region and by end use, with historical data back to 1990 and our forecasts out to 2050. Our top conclusions for plastic in the energy transition are summarized below.
Global plastic demand is estimated at 470MTpa in 2022. For perspective, the 100Mbpd global oil market equates to around 5bn tons per year of crude oil, showing that plastics comprise almost 10% of total global oil demand.
Our outlook in the energy transition sees increasing demand for polymers, most likely to 1,000MTpa by 2050. Many polymers are crucial inputs for new energies. Others are used for high-grade insulation, both thermal and electrical. Others for light-weight composites, which lower the energy consumption of transportation technologies.
Global plastic demand by region. The top billion people in the developed world comprise 12% of the world’s population, but 40% of the world’s plastic demand. We see developed world plastics demand running sideways through 2050, while emerging world demand doubles from 300MTpa to 700MTpa (charts below).

Global plastic demand CAGR? Our numbers are not aggressive and include a continued deceleration in the total global demand CAGR, from 7.5% pa growth in the twenty years ending in 1980, to 6% pa in the twenty years ended 2000, to 3.3% pa in the twenty years ended 2022 and around 2.5% pa in the period ending 2050.
Global plastic consumption per capita. Our numbers include an enormous policy push against waste in the developed world, where consumption today is around 170 kg of plastics per person per year. Conversely, plastic demand in the emerging world is 75% lower and averages 40 kg pp pa today, seen rising to 90 kg pp pa by 2050.

Upside to plastics demand? What worries us about these numbers is that they require historical trends to slow down. Historically, each $k pp pa of GDP is associated with 4kg pp pa of plastic demand. But our numbers assume slowing demand in the developed world and slowing demand in the emerging world (chart below).

Please download the model to stress-test your own variations. Underlying inputs are drawn from technical papers, OECD databases and Plastics Europe. The forecasts are our own.
Plastic demand by end use is broken down in the chart below. 35% of today’s plastics are used as packaging materials, 17% as construction materials and c10% for textiles.
The strongest growth outlook is in electrical products (currently 7-9%) and light-weighting transportation. There are few alternatives to plastics in these applications. Conversely, for packaging materials, we see more muted growth, and more substitution towards bioplastics and cellulose-based products from companies such as Stora Enso.

Upside for plastics in the energy transition is especially important, with plastics used in important components of the energy transition, from EVA encapsulants in solar panels, to the resins in wind turbine blades, to strong and light-weight components in more efficient vehicles, to polyurethane insulating materials surrounding substantively all electric components, batteries and vehicles. Of particular note are fluorinated polymers, where the C-F bond is highly inert, and helps resist degradation in electric vehicle batteries.
Plastic demand by material is broken down in the chart below. Today’s market is c20% polypropylene, c15% LDPE, and other large categories with >5% shares include HDPE, PVC, PET, Polyurethanes and Polystyrenes. We think the strongest growth will be in more recyclable plastics, materials linked to the energy transition, and next-gen materials that underpin new technologies such as additive manufacturing.

Feedstock deflation is likely to be a defining theme in the energy transition, as many polymers draw inputs from the catalytic reforming of naphtha. Today, 70% of BTX reformate is blended into gasoline, but we see this being displaced by the rise of electric vehicles, with particular upside for the polyurethane value chain.
Decarbonizing plastic production is also a topic in our research. As a starting point, our ethane cracker model is linked here, and our economic model for converting olefins into polymers is here. CO2 intensity of different plastics from different facilities is tabulated here.
Plastic recycling. We also see potential for plastic-recycling technologies to displace 8-15Mbpd of potential oil demand growth (i.e., naphtha, LPGs and ethane) by 2060, compared to a business-as-usual scenario of demand growth. All of our plastic recycling research is linked here. After a challenging pathway to de-risking this technology, we see front-runners emerging, such as Agilyx, Alterra and Plastic Energy.