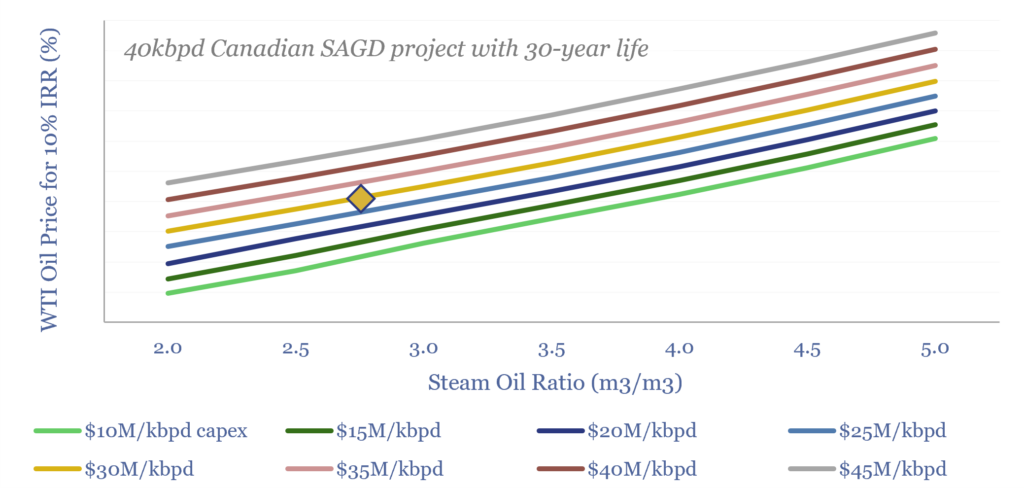
SAGD oil sands economics are modeled in this data-file, generating a 10% IRR, at $60/bbl WTI oil prices in our base case. This hinges on a 2.7 m3/m3 steam oil ratio, for a 4x EROEI. Breakevens can vary from $45-90/bbl depending on capex costs and steam oil ratios.
Canada’s oil sands production has increased from 2.4Mbpd in 2015 to 3.5Mbpd in 2025, based on the data in our Canadian production tracker and E&P screen.
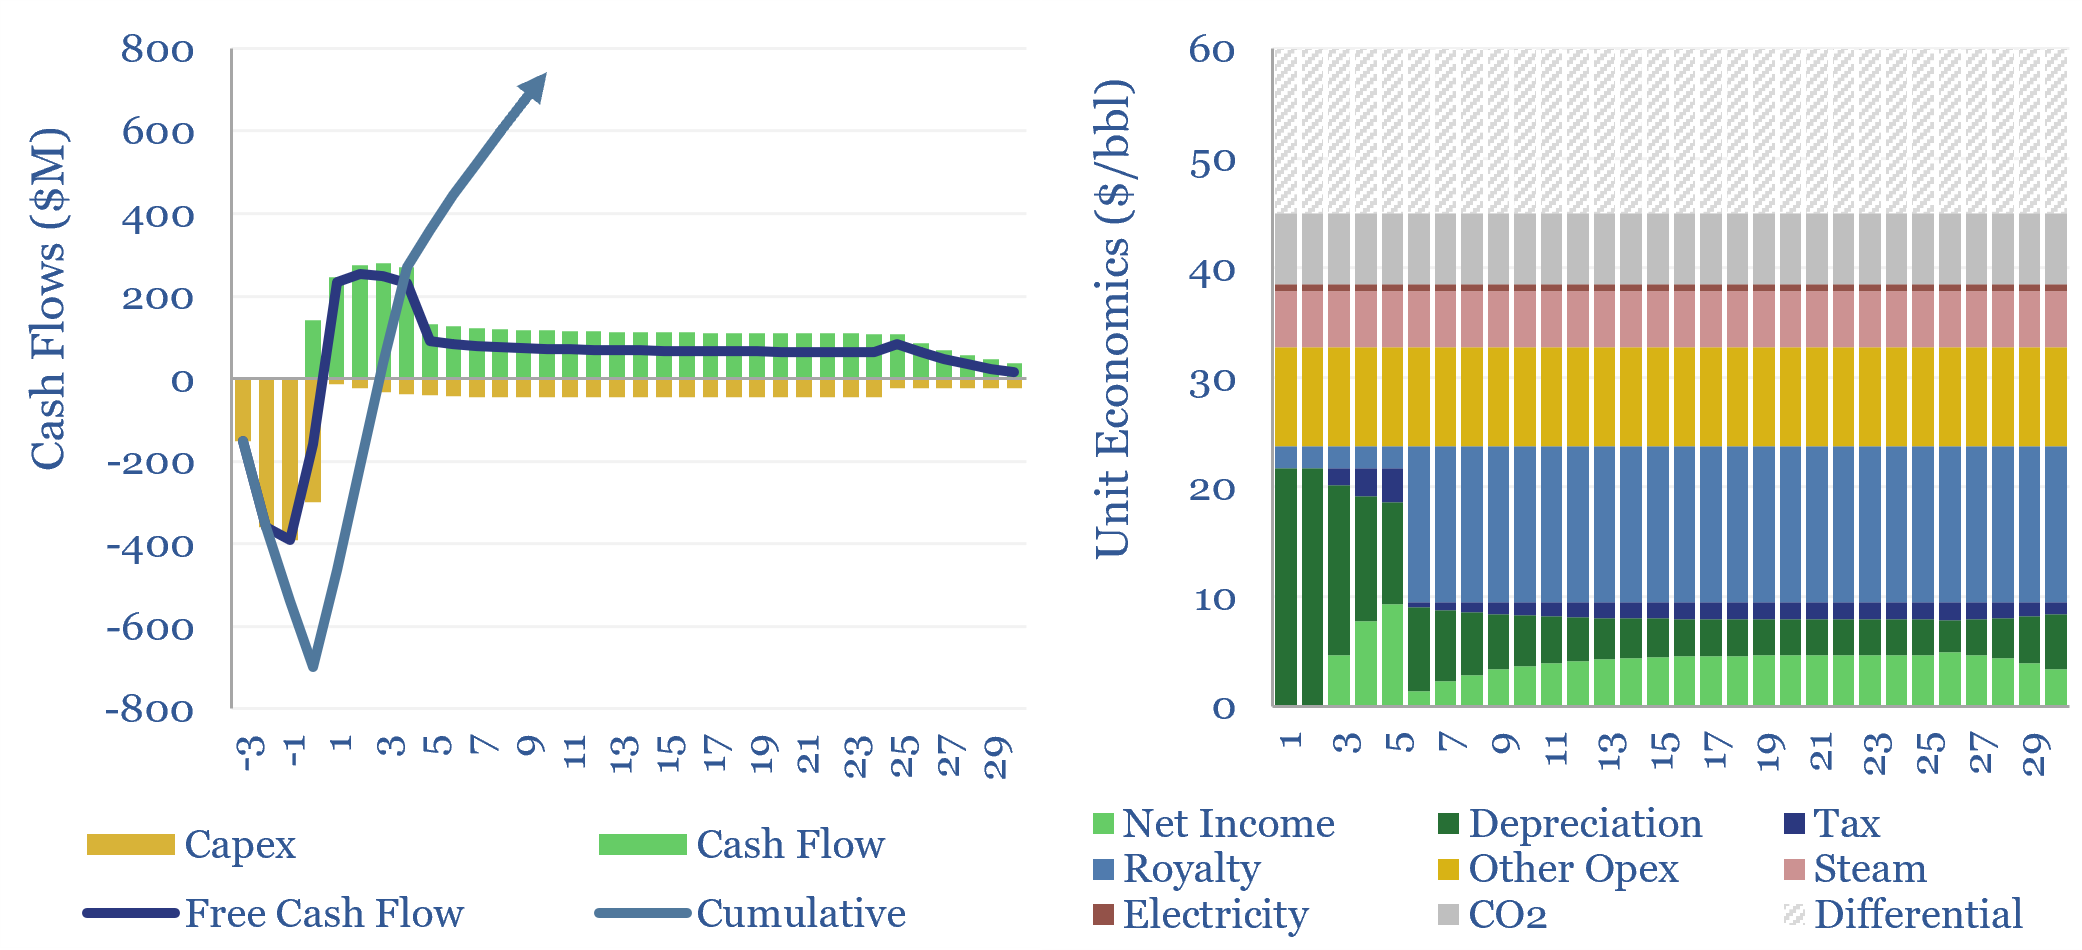
Hence this model assesses SAGD oil sand economics, as a function of capex, opex, energy costs, royalties, income taxes and CO2 prices, which can all be stress-tested in the data-file.
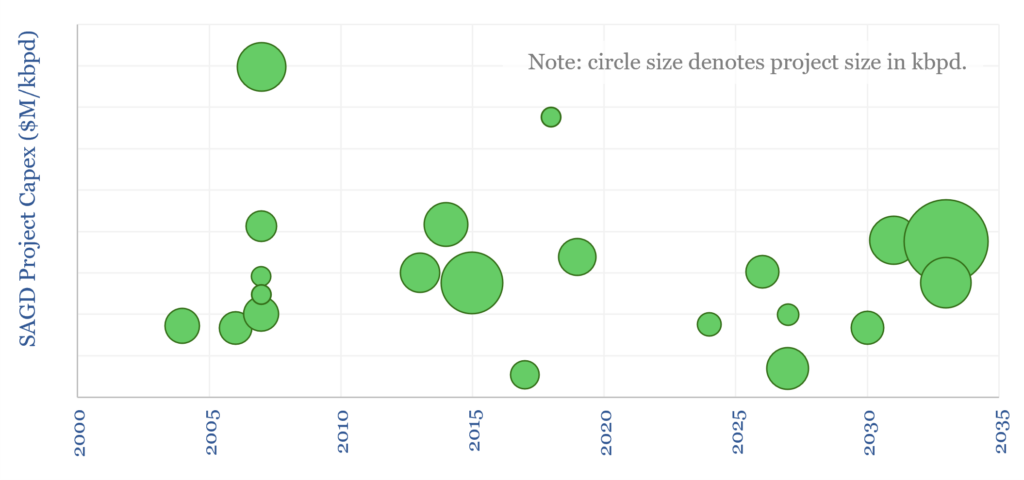
Capex costs for SAGD projects are tabulated across 20 past, present and future projects, which are tabulated in the data-file (chart below), averaging $30M/kbpd, which is comparable with other upstream projects.
Royalty rates in Canada vary from 1% to 40%, depending on oil prices (on an S-curve) and whether a project has recovered its historical costs. This is captured in the model.
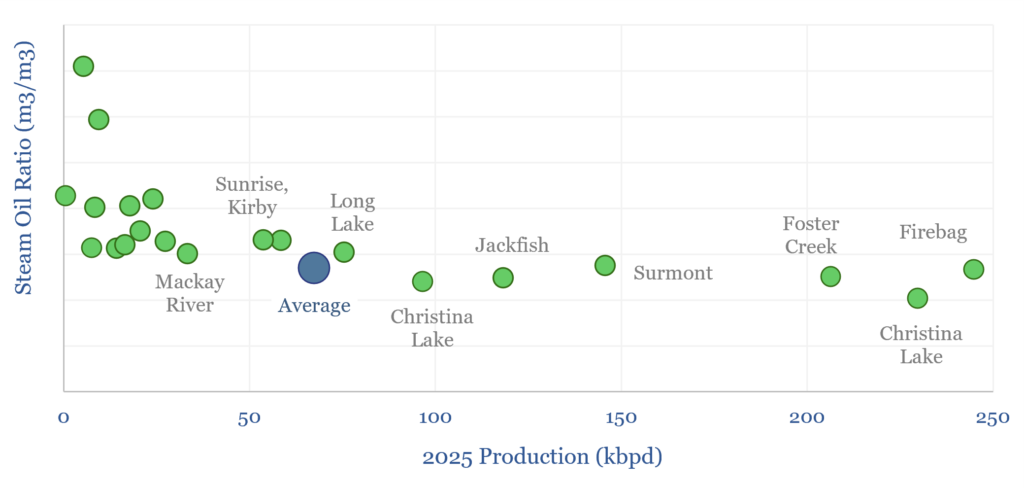
Steam oil ratios are another key economic driver, hence we have tabulated the SOR over time, averaging 2.7 m3/m3 from 20 projects, which are currently producing 1.4Mbpd of bitumen, based on data from the Alberta Energy Regulator.
A 2.7 m3/m3 Steam Oil Ratio equates to an EROEI of about 4x, based on the enthalpy of steam, which equates to upstream CO2 intensity of 70kg/bbl of Scope 1 CO2.
Hence projects that support lower Steam Oil Ratios have been able to scale more (chart above). Doubling the SOR halves the EROEI, and also worsens economics (sensitivity below).
Suncor and CNRL may be economically justified in continuing to expand their SAGD production bases, based on the analysis here, with cash-on-cash breakevens at $40/bbl, 10% IRRs at $60/bbl, cash and 20% IRRs at $85/bbl.
Changing policies could also support SAGD oil sands economics. Most notably, more pipelines could narrow differentials assumed at $15/bbl in our base case. And Canada may decide against ‘going it alone‘ on CO2 taxes in the future, lowering costs by a further $6/bbl?
Please download the data-file to stress test SAGD oil sands economics, across capex, opex, differentials, steam oil ratios, energy costs, CO2 taxes and other fiscal changes.