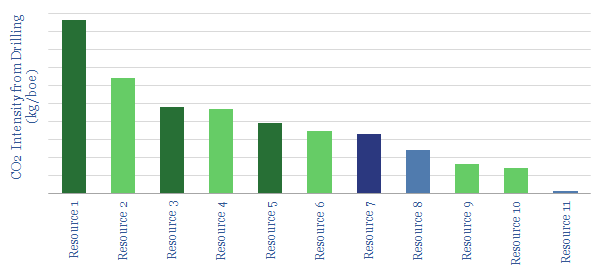
This data-file estimates the CO2 intensity of drilling oil wells, in our usual units of kg/boe. The calculations are conducted bottom-up, based on fuel consumption at onshore, offshore and deep-water rigs; plus drilling days and typical resource volumes per well.
Drilling wells is not the largest portion of the oil industry’s total CO2 intensity. Nevertheless there is a 50x spread between the best and worst barrels, which is wider than other categories we have screened.
Prolific fieldswill have the lowest drilling-CO2 intensities, particularly where they are onshore (e.g., Saudi Arabia). Infill wells at mature deepwater fields may have the highest drilling-CO2.
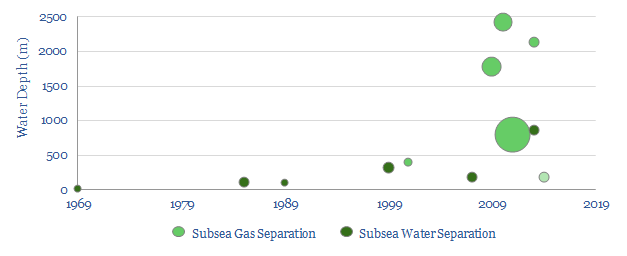
This database covers all 14 subsea separation projectsacross the history of the oil industry, going back to the “dawn of subsea” in 1969.
For each example, we tabulate the asset, region, operator, water depth, process technology, Service company, start-up year, power rating, oil capacity, gas capacity, water capacity and some notes.
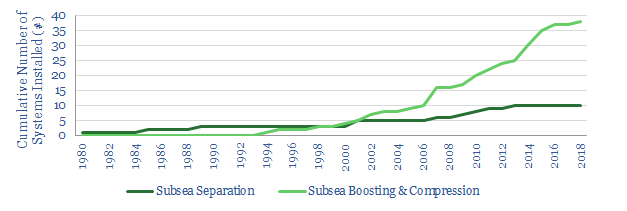
What is interesting about the data is how elusive the technology’s ascent has been. Two of our projects were cancelled. The largest were 2.3MW. Subsea Boosting and Compression has been 4x more prevalent (chart below).
This matters for the Mero pre-salt fieldwhere an unprecedented, giant, 6MW subsea-separation project is being pioneered, to handle high gas and CO2 cuts.
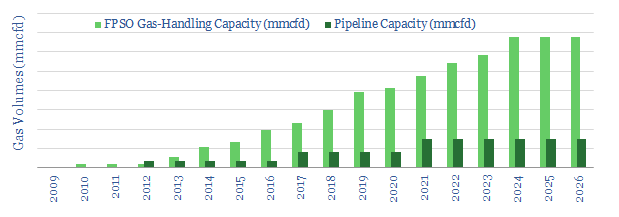
This data-file tracks the construction progress of 30 FPSOsthat are being deployed in the Brazilian pre-salt oil province. In each case, we quantify the vessel’s oil and gas handling capacity, development timing and recent news.
We also compare the FPSOs’ gas-handling capacity with regional pipeline capacity. There will only be room to monetize one-third of the pre-salt’s produced gas volumes by the mid-2020s. The rest must be re-injected (chart below).
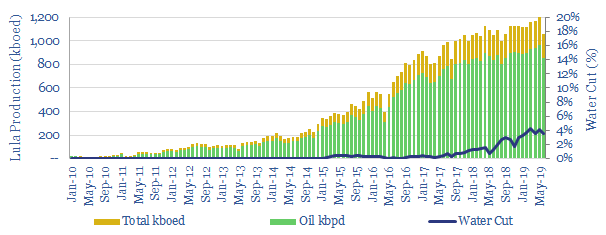
This data-file tracks the Lula oilfield, well-by-well, FPSO-by-FPSO, aggregating data from over 100 production reports, which are published monthly by Brazil’s national hydrocarbon regulator.
Hence we have formulated “production forecasts” for each FPSO, and for the entire field; in 2H19 and in 1H20. This matters for oil markets; and for pre-salt producers, such as Petrobas, Shell and Galp.
Our outlook is for slowing growth, due to rising water- and gas-cuts, which are reviewed well-by-well. One FPSO is now definitively constrained by gas-handling capacity. Another is off-plateau due to maturity. Six Lula FPSOs are now negotiating water-cuts, as shown in the data-file.
1H19 production was lower than expected, at just 72% of total installed FPSO capacity. Our notes attribute the drivers, and contextualise the growth ahead.
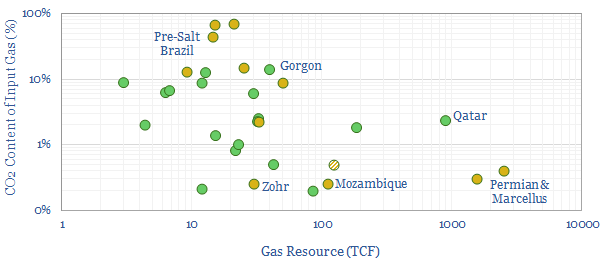
The CO2 content of gas fields is going to matter increasingly, for future gas development decisions: CO2 must be lowered to 50ppm before gas can be liquefied, adding cost. Moreover, it is no longer acceptable to vent the separated CO2 into the atmosphere. Carbon capture and storage costs range from $80-130/ton while we estimate the overall CO2 intensity of natural gas value chains to be around 56 kg/mcf.
Large, low-CO2 resources like the Permian, Marcellus and Mozambique are well-positioned to dominate future LNG growth. LNG markets are set to treble in our energy transition roadmap, rising from 400MTpa today to 1,100MTpa by 2050, for a c4% CAGR. The main reason is to displace coal, which is 2x more CO2 intensive.
What is the cost of switching from coal to gas? In the US, the price of delivered coal averaged $43/ton over the 2010-2019 timeframe, according to data from the EIA, which translates into a ridiculously cheap 0.7 c/kWh of thermal energy (kWh-th). Over the same timeframe, the average price of natural gas was $3.3/mcf, which translates into 1.1 c/kWh-th. Thus the excess cost of natural gas was around 0.4 c/kWh-th. Directly substituting coal fuel for gas fuel therefore incurred a cost of $20/ton of CO2 that was ‘avoided’. In Europe the premium for natural gas was around 1.5c/kWh-th incurring a cost of $80/ton of CO2 avoided. This is low on our CO2 abatement cost curve.
The present data-file tabulates 30 major gas resources around the world, their volumes, the CO2 content of those gas fields and how the CO2 is handled.
Cookies?
This website uses necessary cookies. Our cookies are simply to improve your experience. We do not undertake any advertising or targeting via our cookies. By clicking 'accept' or continuing to use the website, you consent to our use of cookies.AcceptTerms & Conditions
Privacy & Cookies Policy
Privacy Overview
This website uses cookies to improve your experience while you navigate through the website. Out of these, the cookies that are categorized as necessary are stored on your browser as they are essential for the working of basic functionalities of the website. We also use third-party cookies that help us analyze and understand how you use this website. These cookies will be stored in your browser only with your consent. You also have the option to opt-out of these cookies. But opting out of some of these cookies may affect your browsing experience.
Necessary cookies are absolutely essential for the website to function properly. This category only includes cookies that ensures basic functionalities and security features of the website. These cookies do not store any personal information.
Any cookies that may not be particularly necessary for the website to function and is used specifically to collect user personal data via analytics, ads, other embedded contents are termed as non-necessary cookies. It is mandatory to procure user consent prior to running these cookies on your website.