The US consumes 25,000 TWH of primary energy per year, which equates to 13,000 TWH of useful energy, and emits 6GTpa of CO2. This model captures our best estimates for what a pragmatic and economical decarbonization of the US will look like, reaching net zero in 2050, with energy consumption at 11,500 TWH per year.
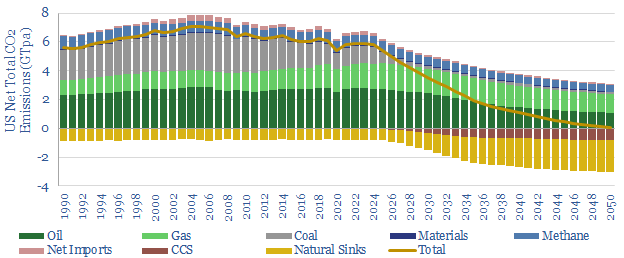
Decarbonization of an entire economy is complex, but it can be modelled, starting with a granular, 200-line breakdown of where CO2 is emitted, industry-by-industry, fuel-by-fuel. If we take 2022 as a baseline, US CO2 emissions were almost 6GTpa, comprising 7GTpa of gross emissions, and 0.8GTpa of net carbon absorbed in US forests.
Of the 7GTpa gross emissions, 2.8GTpa was from oil combustion (providing 27% of useful energy consumption, mainly for transportation), 1.7GTpa was from gas combustion (for 49% of useful energy consumption), 1.2GTpa was from coal consumption (10% of useful energy). Another 0.7GTpa was methane leaks — from coal mines to landfill sites — and around 0.3GTpa is embedded in imports or in direct process emissions from materials.
Our model is configured so that different technology pathways will ‘come into the money’ depending on the average price that society is willing to pay for CO2 abatement. Our view is that low-cost decarbonization will prove more tolerable than high-cost decarbonization, and that ultimately the balance of options in this model will decarbonize the US for an average cost below $50/ton, or around 3% of the income of the average American.
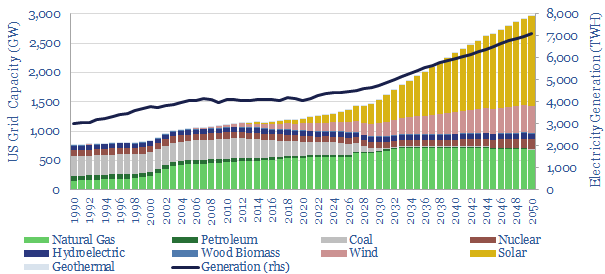
How will the US power mix change by 2050? Today’s US power grid is 1,300 GW. This rises by 2.3x to 3,000 GW by 2050. The largest gains are seen for solar (13x increase to 1,500 GW), wind (3x increase to 500 GW), nuclear (60% increase to 160GW) and natural gas (20% increase to 700 GW). This scenario sees 50% of all net US electricity coming from wind and solar by 2050.
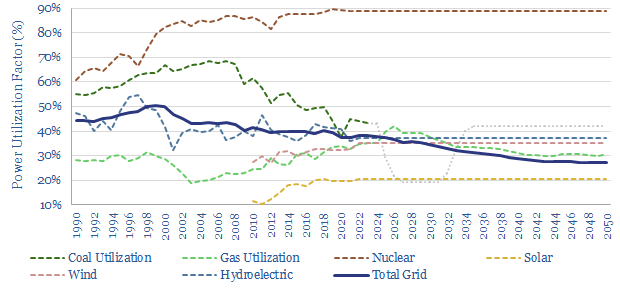
How does the US grid change by 2050? Total circuit kilometers in the US power grid need to rise by over 3x in our models (note here). Electricity rises from providing c30% of all useful energy today to 60% by 2050. But in addition, the energy sources gaining share in the electricity mix tend to be lower utilization, so much grid infrastructure simply gets used less. Our model sees the average utilization of the grid halving from a peak of 50% in 1998 to 27% in 2050 (chart below). In our view, as things stand, grid bottlenecks remain the biggest hurdle in our forecasts (TSE power grids research here).
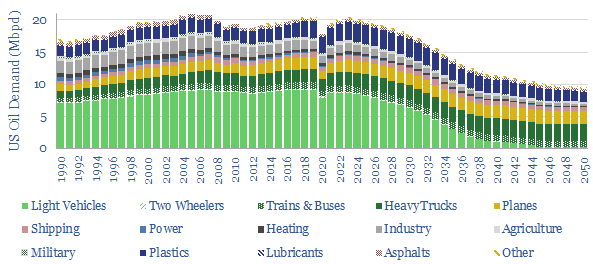
How will US oil demand change through 2050? Oil demand has already peaked, at 20.7Mbpd in 2007, and more recently at 20.5Mbpd in 2019. We see US oil demand falling back to 8Mbpd in 2050 (global oil model here). This reflects the electrification of the light vehicle fleet, where EVs are 2-6x more efficient than ICEs. The remaining oil demand is for aviation, long-distance trucking and plastics. The main reason these value chains remain oily is due to limits on the energy density of batteries and very high costs for hydrogen transport and e-fuels.
The overall energy system in the US falls back from 13,000 TWH in 2022 to 11,500 TWH in 2050, even as GDP per capita rises at 1.25% per year (you can flex this number in the model). The main reason is efficiency gains. Our best two notes, explaining our forecasts for accelerating energy efficiency are here and here.
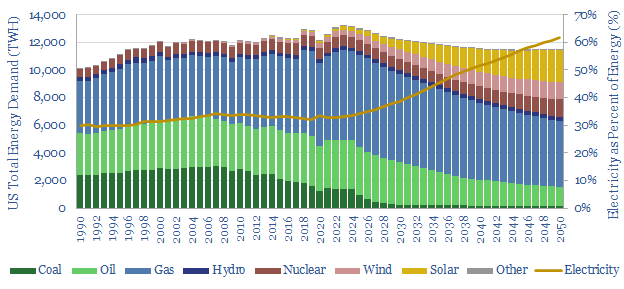
Our model also includes a huge shift from coal to gas. Gas demand falls 25% from 90bcfd in 2022 to 66bcfd in 2050 (global gas model here). Switching coal to gas saves 50-60% of the CO2 for the same amount of useful energy, due to the chemistry of the methane molecule (half of the energy is from converting the H in CH4 to H2O, versus the energy in coal primarily coming from carbon, note here). Brayton Cycles are also inherently more efficient than steam cycles (note here) hence typical power plant efficiencies are 38% for coal, 40-45% for simple cycle gas and 55-60% for combined cycle gas (models here).
The US has already saved 600MTpa of net CO2 emissions as electricity generated from coal fell from 2,000 TWH in 2007 to 830 TWH in 2022, while gas power ramped up from 900 TWH to 1,700 TWH over the same timeframe. Coal-to-gas substitution continues in our roadmap. And all the more so because gas is easier to decarbonize with CCS.
CCS and nature-based solutions complete our bridge to net zero. We see CCS ramping up from <40MTpa today to 500MTpa within a decade (note here), 700MTpa by 2040 and ultimately over 800MTpa by 2050. We are currently seeing a boom in blue value chains, catalysed by reforms to the 45Q incentive, under the US IRA, for example blue ammonia and blue steel. All of our CCS research is here.
CO2 removals using nature-based solutions treble from 760MTpa today to over 2GTpa in this roadmap. This requires reforesting about 300M acres at an average CO2 uptake rate of 5 tons of CO2 per acre per year (data here). Remember, old forest stands effectively stop sequestering CO2, but young forests sequester rapidly (note here). Independent studies have estimated as much as 500M acres of reforestation potential in the US, and for perspective, 30M acres of US cropland is tied up in producing ethanol.
Controversies and debates? Time for a humility moment. This model reflects our best estimates after 15 years of energy analysis, and 5 years focused exclusively on energy transition and decarbonization topics. Every year, we learn more, and adjust our models accordingly. If you would like to discuss or debate any assumptions or controversies in our energy transition roadmaps, then please do contact us.