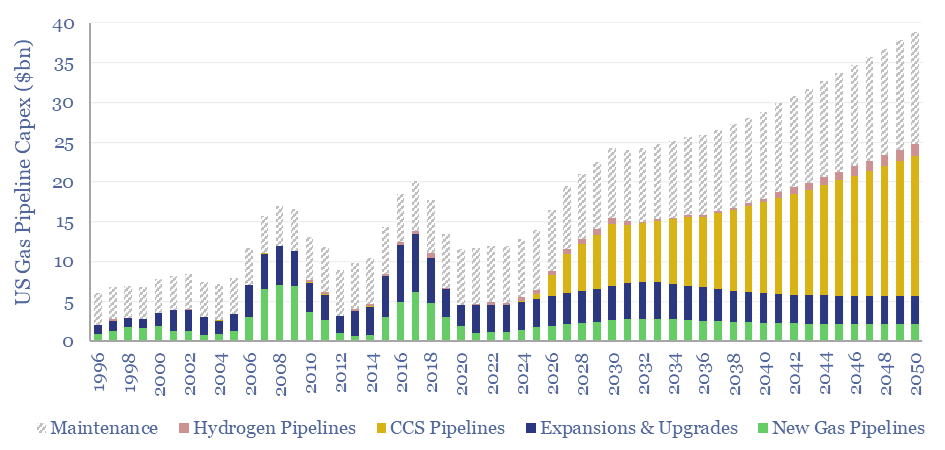
US gas pipeline capex ran at $12bn pa in 2023, but likely needs to treble to reach net zero by 2050, mainly to support 1GTpa of CCS. Midstream capex for natural gas, CO2 transportation and hydrogen production are forecast out to 2050 in this data-file. Numbers can be stress-tested in the model.
The US operates the most extensive gas pipeline network in the world, moving 100bcfd of natural gas through 200,000 miles of transmission lines.
To build this network, the US has spent $14bn pa over the past decade, to construct a further 10,000 miles of transmission lines, which can carry 120bcfd, at an average capex cost of $3M/mile; while another c50% of the capex is spent maintaining the existing network.
Achieving net zero by 2050 would likely require total US gas pipeline capex to treble to almost $40bn per year, mainly as CCS volumes must ramp to 1GTpa, but also as gas displaces coal in the short-medium term and US hydrogen volumes almost double from 12MTpa to 21MTpa in our hydrogen outlook.
Our forecasts for new gas pipeline capex, CCS pipeline capex and hydrogen pipeline capex are calculated, in each case, by multiplying incremental volumes x new pipeline diameter-kilometers needed per unit of volume x capex cost per diameter-kilometer.
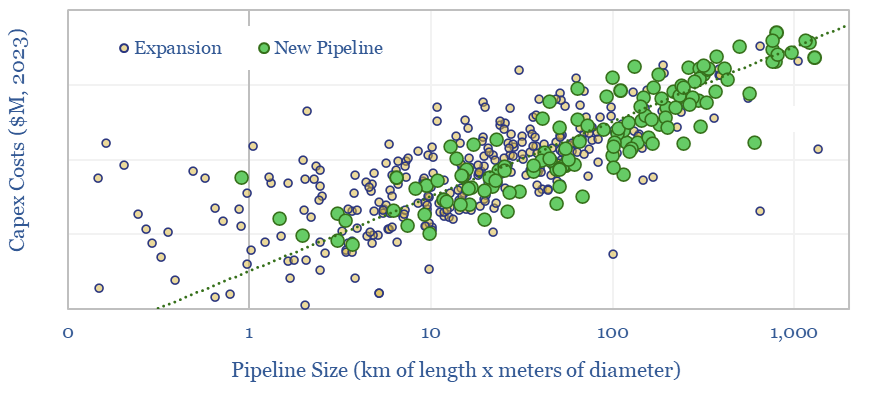
Capex costs of US gas pipelines are informed by a comprehensive database published by the EIA, which we scrubbed and cross-plotted, providing a good estimate for capex costs in $M per meter of diameter and per km of length (chart below).
The US already contains 50 CO2 pipelines with 5,000 miles of length, implying 100-miles per line. However, the main gas transmission network consists of 30 x large lines each running 2,000 – 15,000 miles. GTpa scale CCS in the US could continue leaning on smaller regional lines, but likely also requires an interstate network, raising the mean average CCS line length to 1,250 miles by 2050. Whether the US adopts CCS simply in regional hubs, or more extensively, is thus the largest determinant of total midstream capex requirements through 2050.
Estimates for the number and diameter of pipelines needed per bcfd or per MTpa – of natural gas, CO2 and hydrogen pipelines – are derived from the engineering equations in our US gas pipeline models.
All of the numbers can be stress-tested in the model. However, a helpful broader reference file is our roadmap model for US decarbonization. Our outlook for gas pipelines in the energy transition is also informed by recent research, summarized below.