Search results for: “glass”
-
Vapor deposition: leading companies?
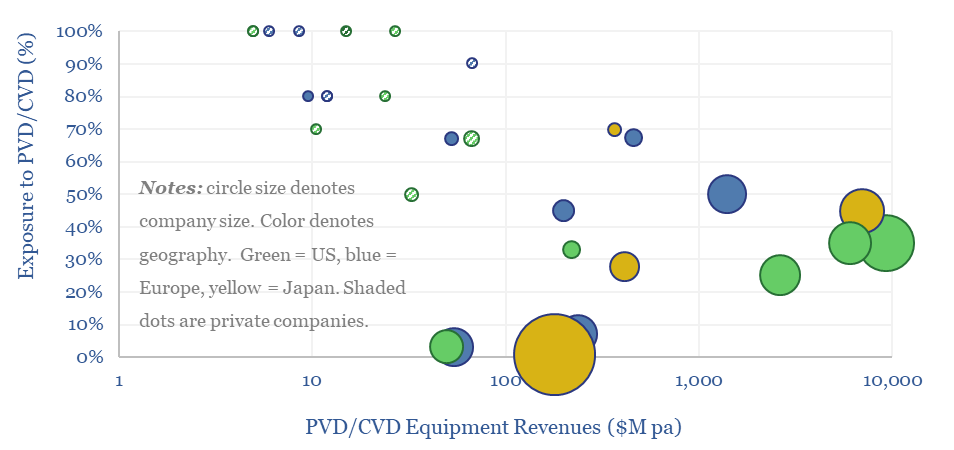
This data-file is a screen of leading companies in vapor deposition, manufacturing the key equipment for making PV silicon, solar, AI chips and LED lighting solutions. The market for vapor deposition equipment is worth $50bn pa and growing at 8% per year. Who stands out?
-
Global energy demand by end use?
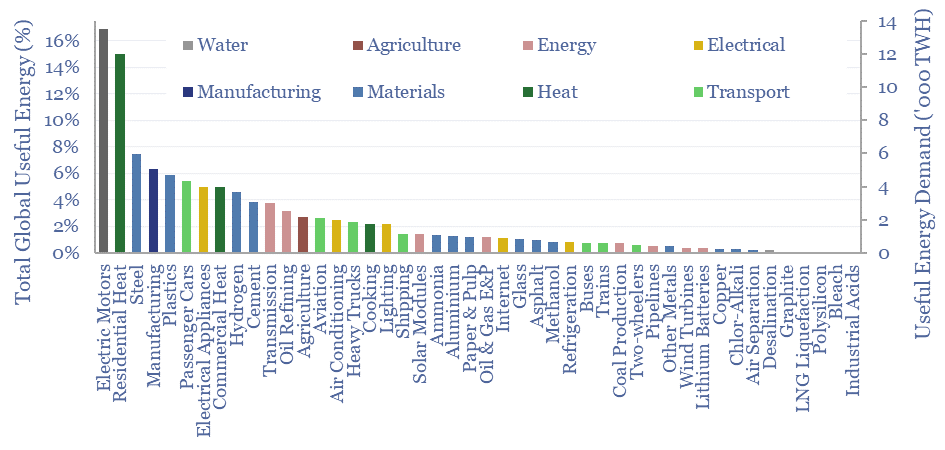
This data-file is a breakdown of global energy demand by end use, drawing across our entire research library, to disaggregate the global energy system across almost 50 applications, across transportation, heat, electricity, materials and manufacturing. Numbers, calculations, efficiencies and heating temperatures are in the data-file.
-
Solar module production by company?
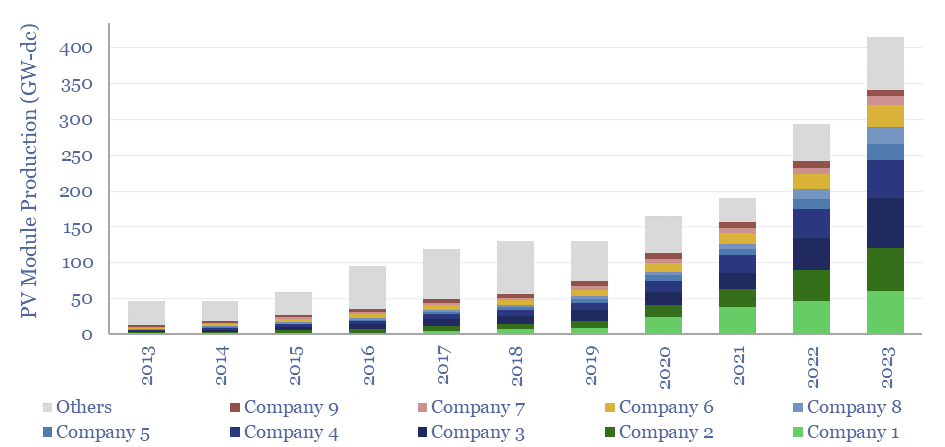
The world produced over 400GW of solar modules in 2023, which is up 10x from a decade ago. This data-file breaks down solar module production by company and over time, comparing the companies by solar module selling prices ($/kW), margins (%), efficiency (%), transparency, and technology development.
-
Global PGM demand: breakdown by metal and use?
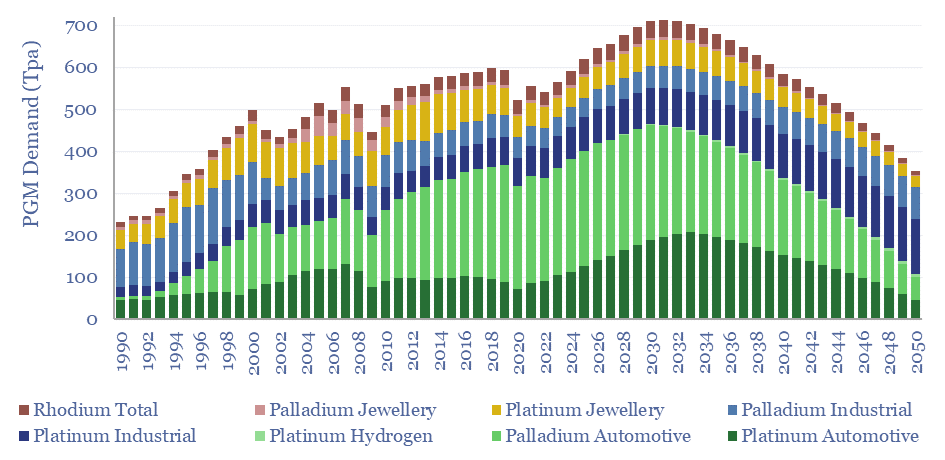
Core global PGM demand ran at 565 tons in 2023, which remains c6% lower than the all-time peak demand of 600Tpa in 2019. We model a recovery to 700 Tpa of demand for platinum, palladium and rhodium in 2030, then a long run decline to 350Tpa if EVs ultimately reach 90% of vehicle sales by…
-
Material and manufacturing costs by region: China vs US vs Europe?
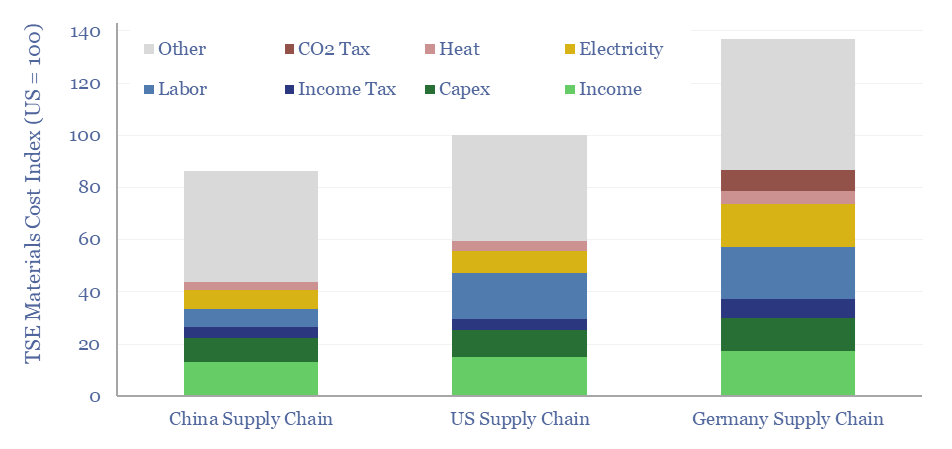
Material and manufacturing costs by region are compared in this data-file for China vs the US vs Europe. Generally, compared with the US, materials costs are 10% lower in China, and 40% higher in Germany, although it depends upon the specific value chain. A dozen different examples are contrasted in this data-file, especially for solar…
-
Global hydrogen: market breakdown?
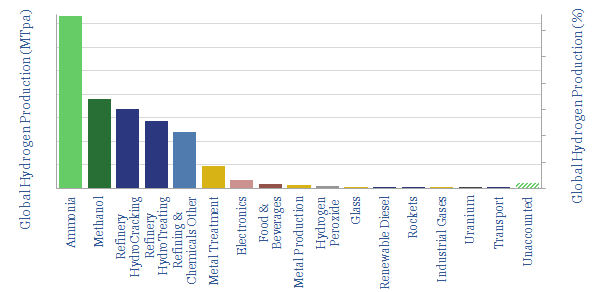
This data-file is a global hydrogen market breakdown, disaggregating the 110MTpa market (mainly ammonia, methanol and refining), how it is met via different production technologies, and our estimates of those technologies’ costs (in $/kg) and CO2 intensities (in kg/kg or tons/ton).
-
Global steel supply-demand model?
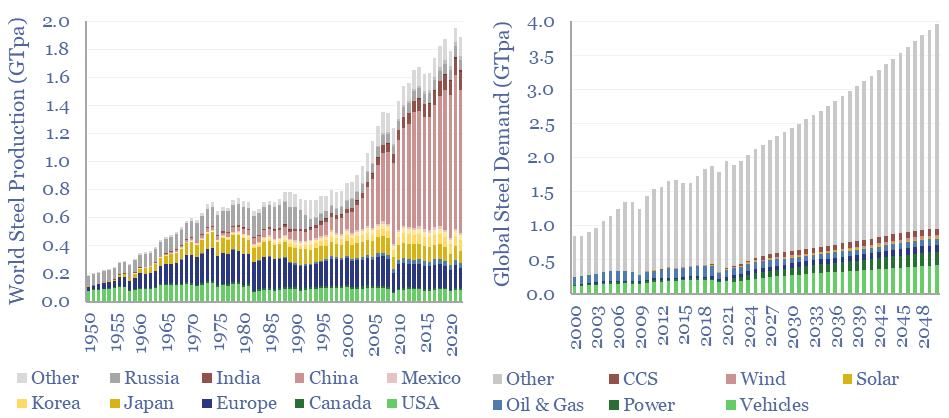
Global steel supply-demand runs at 2GTpa in 2023, having doubled since 2003. Our best estimate is that steel demand rises another 80%, to 3.6GTpa by 2050, including due to the energy transition. Global steel production by country is now dominated by China, whose output exceeds 1GTpa, which is 8x the #2 producer, India, at 125MTpa.
-
Market concentration by industry in the energy transition?
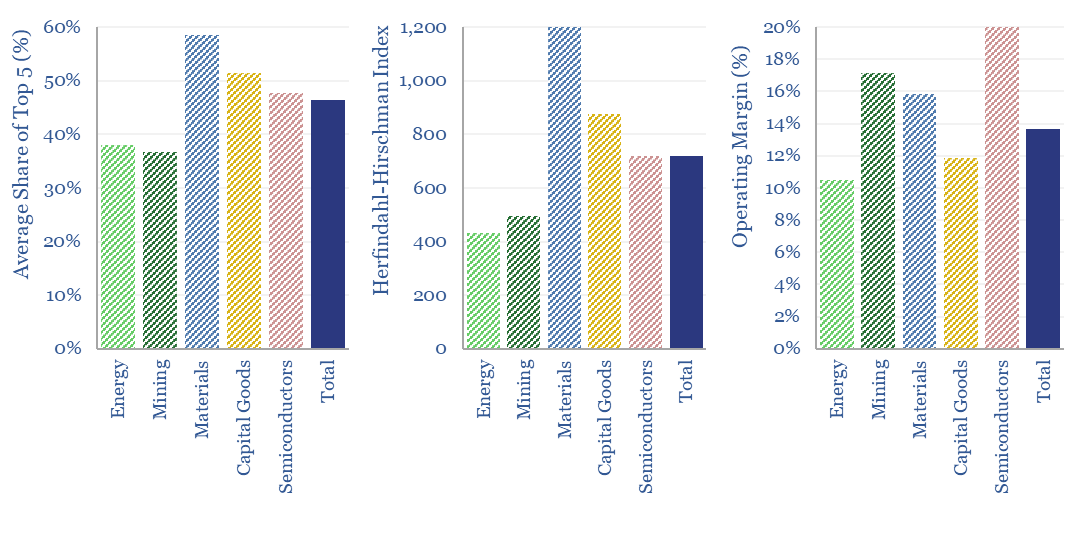
What is the market concentration by industry in energy, mining, materials, semiconductors, capital goods and other sectors that matter in the energy transition? The top five firms tend to control 45% of their respective markets, yielding a ‘Herfindahl Hirschman Index’ (HHI) of 700.
-
Mitsui Chemicals: solar encapsulants?
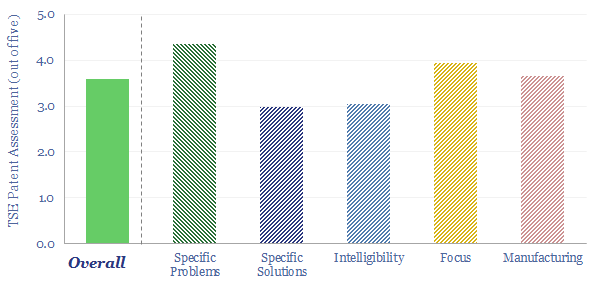
Solar encapsulants are 300-500μm thick films, protecting solar cells from moisture, dirt and degradation; electrically insulating them at 4 x 10^15 Ωcm resistivity; and yet allowing 90% light transmittance. The industry is moving away from commoditized EVA towards specialized blends of co-polymers and additives. Is there a growing moat around Mitsui Chemicals’ solar encapsulants?
-
Commodity prices: metals, materials and chemicals?
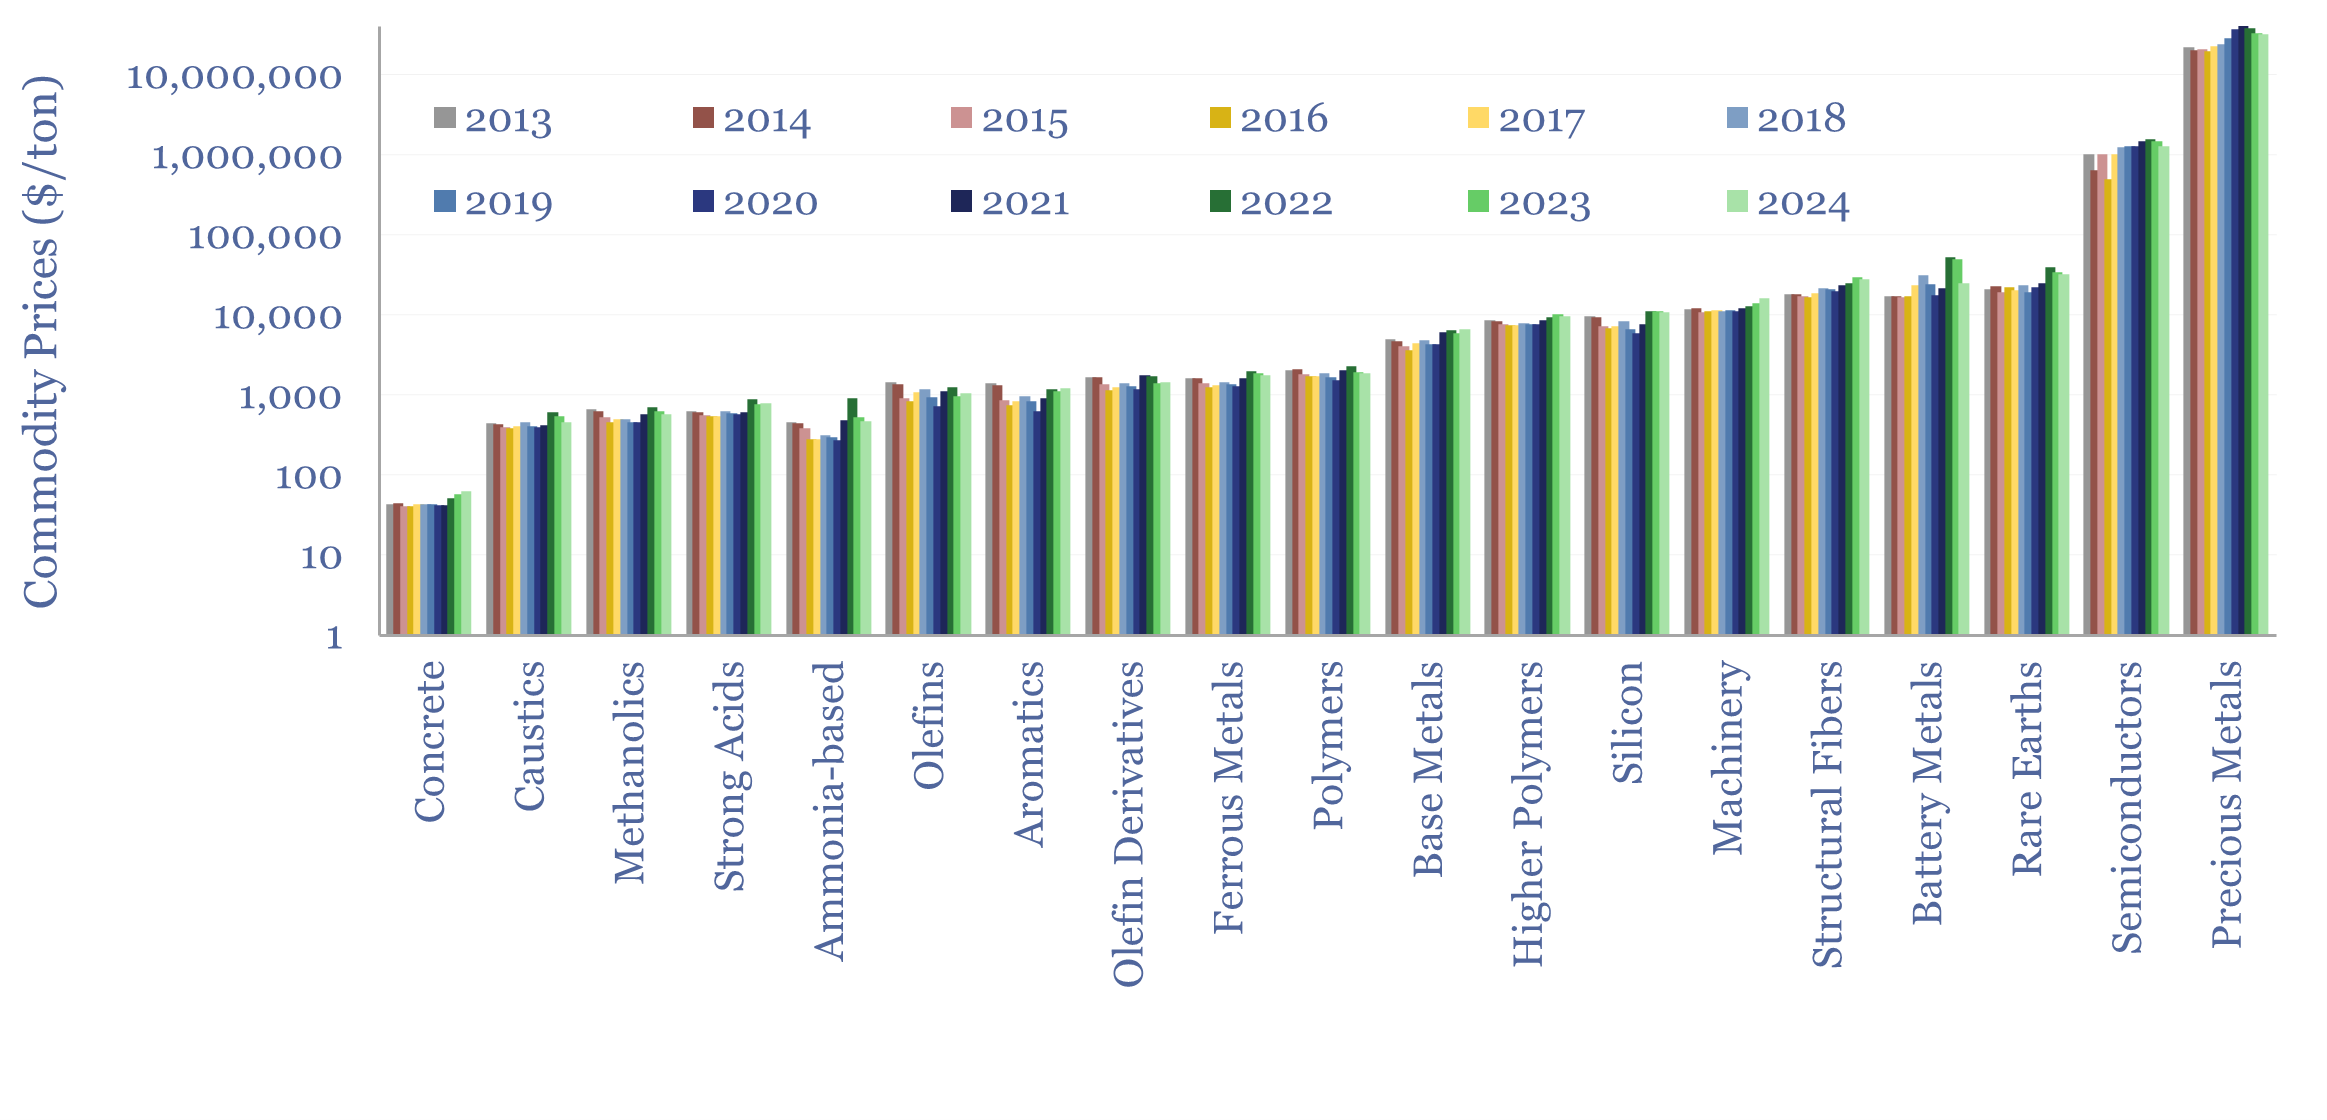
Annual commodity prices are tabulated in this database for 70 material commodities, as a useful reference file; covering steel prices, other metal prices, chemicals prices, polymer prices, with data going back to 2012, all compared in $/ton. We have updated the data-file for 2024 data in May-2025.
Content by Category
- Batteries (89)
- Biofuels (44)
- Carbon Intensity (49)
- CCS (63)
- CO2 Removals (9)
- Coal (38)
- Company Diligence (94)
- Data Models (838)
- Decarbonization (160)
- Demand (110)
- Digital (59)
- Downstream (44)
- Economic Model (204)
- Energy Efficiency (75)
- Hydrogen (63)
- Industry Data (279)
- LNG (48)
- Materials (82)
- Metals (80)
- Midstream (43)
- Natural Gas (148)
- Nature (76)
- Nuclear (23)
- Oil (164)
- Patents (38)
- Plastics (44)
- Power Grids (130)
- Renewables (149)
- Screen (117)
- Semiconductors (32)
- Shale (51)
- Solar (68)
- Supply-Demand (45)
- Vehicles (90)
- Wind (44)
- Written Research (354)