Reserve margins: by ISO and over time?
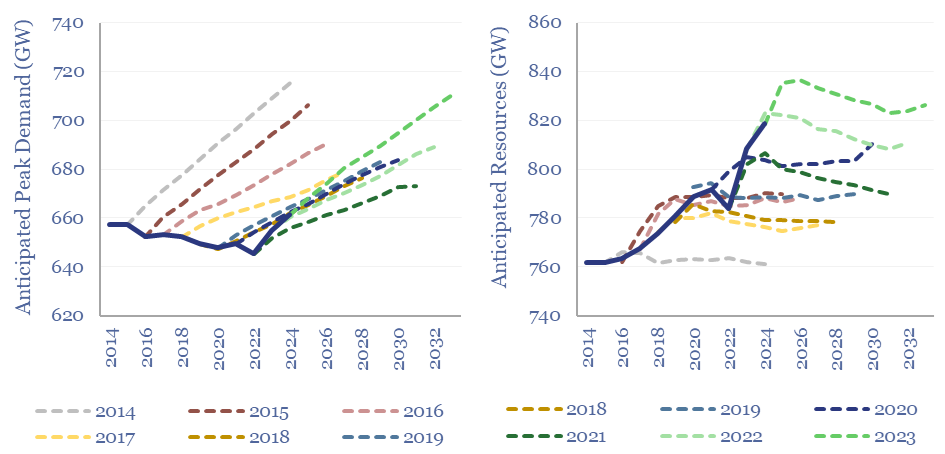
Reserve margins across major ISOs in the US power grid average 29% in 2024, are seen declining to 21% in the next decade by NERC, but could decline further, falling…
the research consultancy for energy technologies
Reserve margins across major ISOs in the US power grid average 29% in 2024, are seen declining to 21% in the next decade by NERC, but could decline further, falling…
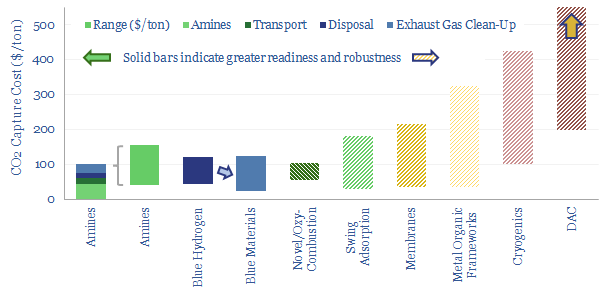
…to remove dusts, SO2, NOXs, a post-wash and limits on the ramp rates of power plants. This all adds costs. Leading amines for CCS, which have been de-risked by use…
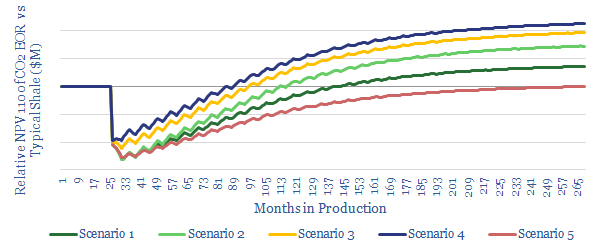
…of decarbonised gas-power and Permian CO2-EOR… First, this week, we finished reviewing 350 technical papers from the shale industry’s 2019 URTEC conference. The biggest YoY delta is that publications into…
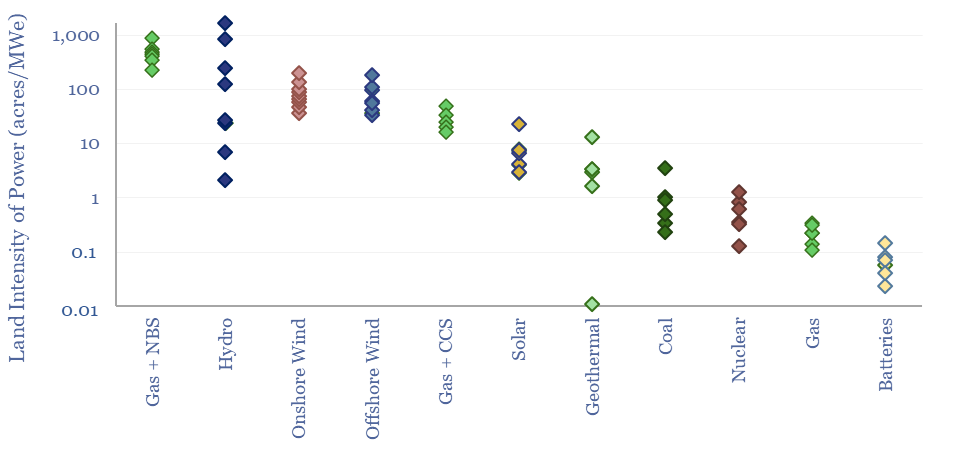
This data-file compares the land intensity of energy technologies and energy transition technologies. Land use is estimated in acres per MW of power generation, or in tons of CO2-equivalents abated…
…and has 60-90% production efficiency, which is far worse than the best batteries we have researched. https://thundersaidenergy.com/downloads/hydrogen-opportunities-an-overview/ Can hydrogen be economic: in heat, power or transportation? Costs matter for consumers…
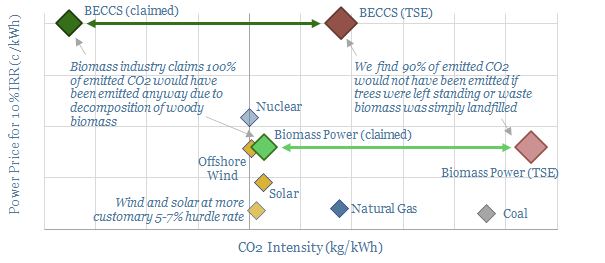
…power as the energy transition evolves? This 18-page analysis leaves us cautious. $499.00 – Purchase Checkout Added to cart Arguments in favor of biomass are outlined on pages 2-3, using the carbon…
…volatility issues for later. But eventually, we model that this will result in power grids becoming more expensive and more volatile, which could end up having negative consequences, both for…
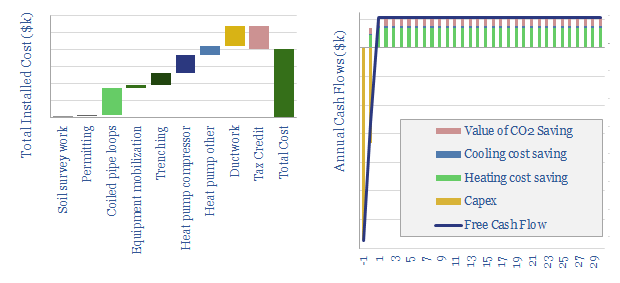
…be stress-tested, flexing annual heating/cooling demands, coefficients of performance, as well as oil, gas, power and CO2 prices, to see how heat pump economics vary. Also included are a granular…
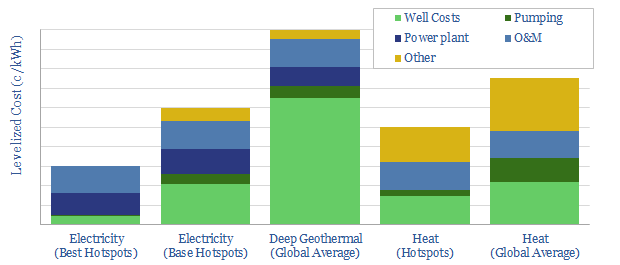
…note finds next-generation geothermal economics can be very competitive, both for power and heat. Pilot projects are accelerating and new companies are forming. But the greatest challenge is execution, which…
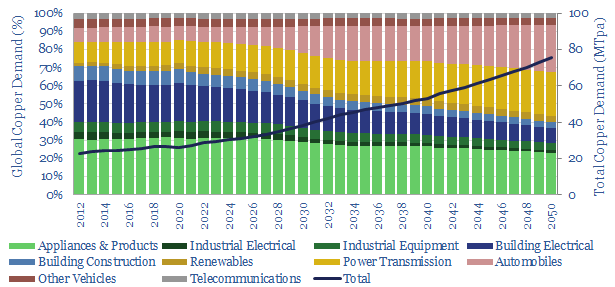
…our base case scenario. The global copper market today comprises 32% appliances, 28% buildings, 14% power T&D, 13% vehicles, 10% industrial equipment and 4% renewables, according to data from the…