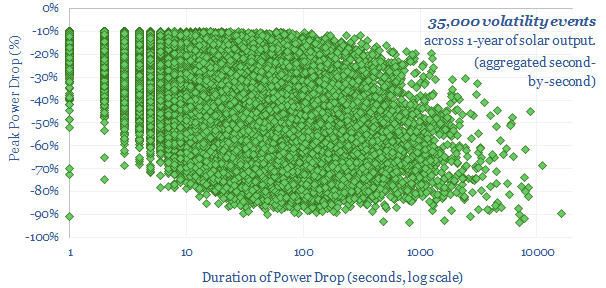
…the power drops due to the sun setting. Then we aggregated all of the second-by-second volatility and power drops. The typical second-by-second volatility of solar power is surprisingly high, with…
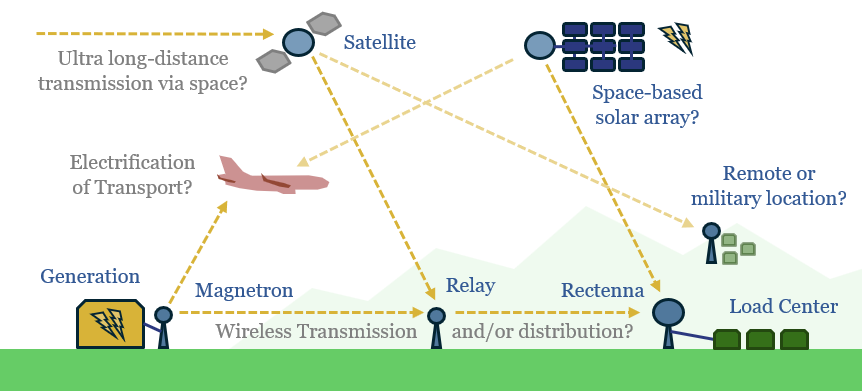
…channel something out of Dune II, they could be used to power flying aircraft or to beam solar power from space (pages 7-8). The efficiency of beaming power, from generation…
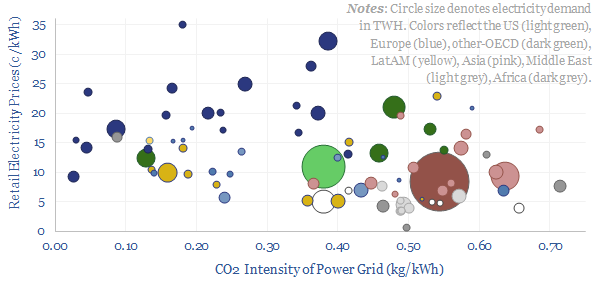
This data-file compares electricity prices (in c/kWh) vs power grids’ CO2 intensities (in kg/kWh), country-by-country. Retail electricity prices average 11c/kWh globally, of which 50-60% is wholesale power generation, 25-35% is…
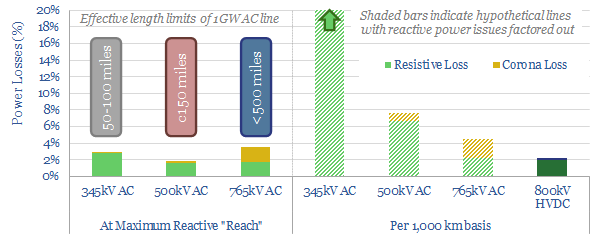
…physics of power transmission are laid out on pages 5-7, with worked examples showing how the existing grid transmits relatively small power quantities over relatively low distances, but resistive power…
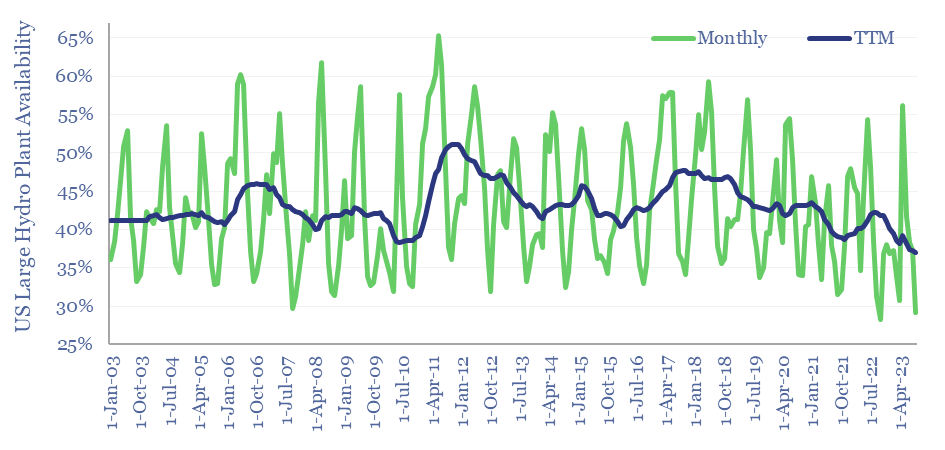
Hydro power generation by facility is tabulated in this data-file for the 20 largest hydro-electric plants in the US. The average US hydro facility achieves 43% availability, varying from 39%…
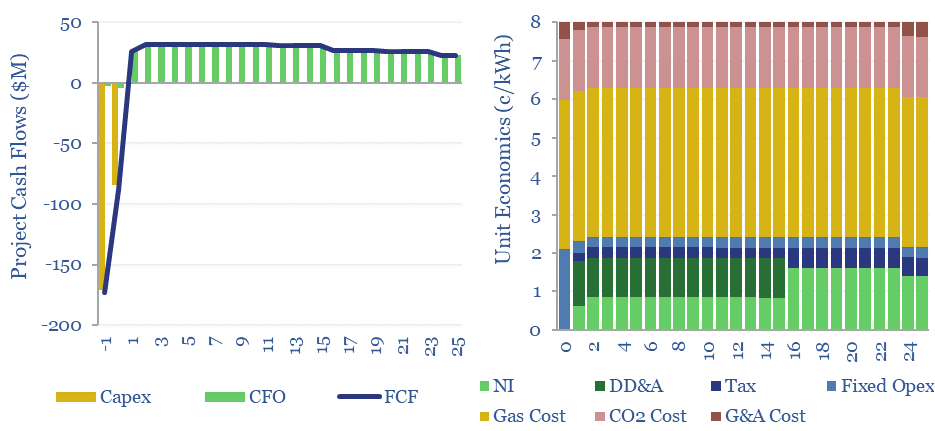
…second only to coal at 35% of global electricity generation. Simply switching coal-fired power to gas-fired power avoids c60% of the CO2. CO2 abatement costs are generally low. While a…
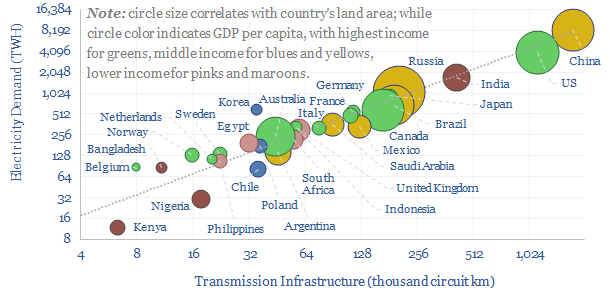
…power transmission lines and 110M kilometers of power distribution lines. Useful rules of thumb follow below. $549.00 – Purchase Checkout Added to cart What are circuit kilometers? One ‘network kilometer’ of power…
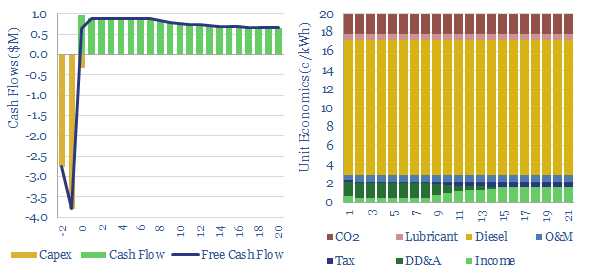
…oil products to the facility. Levelized costs of diesel power generation can be stress-tested in this economic model. $499.00 – Purchase Checkout Added to cart A diesel genset includes an engine, power…
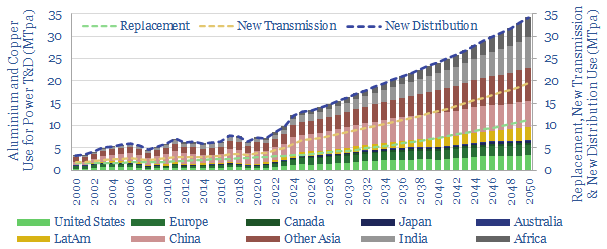
…progress may lead to bottlenecks, then a boom? This 12-page note quantifies rising power grid metals demand, demand for circuit kilometers, and who benefits? $499.00 – Purchase Checkout Added to cart Power…
…guidance document gives the following example: “A toy manufacturer places solar panels on the roof of its plant to generate power, and advertises that its plant is ‘‘100% solar-powered.’’ The…