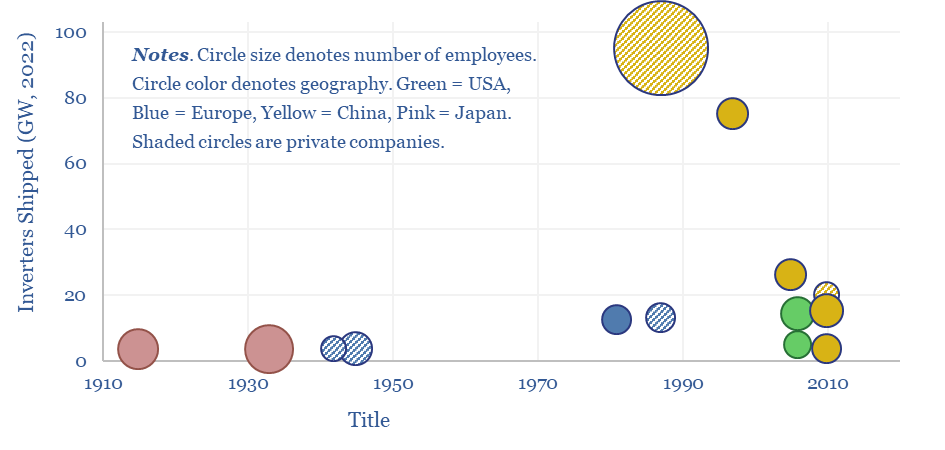
…The ability to control reactive power with a +/- 0.8 leading/lagging power factor is typical. As is the ability to limit total harmonic distortion below 3% (charts below). While Chinese-made…
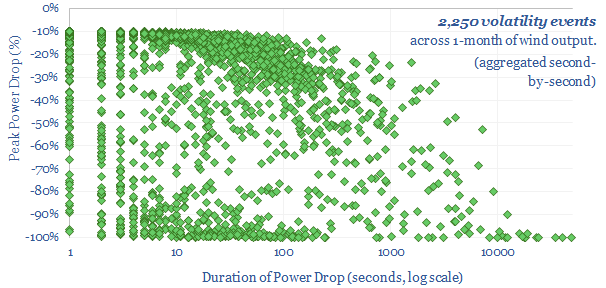
…90% of that previous 10-minute average power output. The average power drop is the average reduction in power output during the duration of the power drop, compared to the prior…
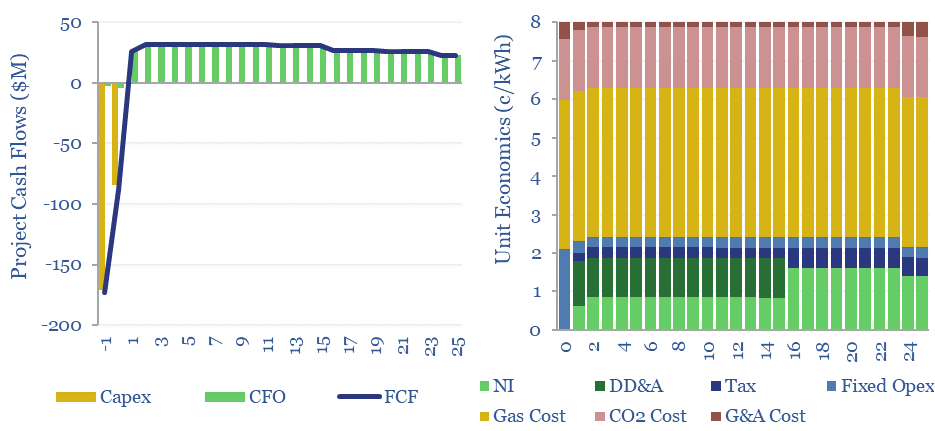
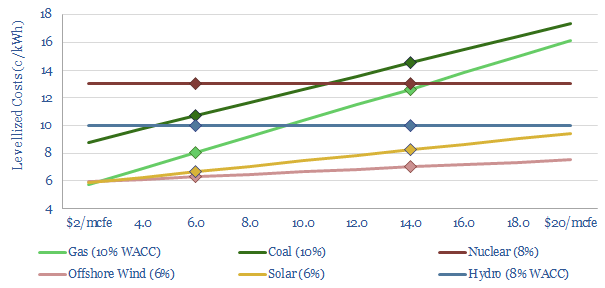
…tax rates (chart below). Gas-fired power generation explained 23% of global electricity generation in 2023, second only to coal at 35% of global electricity generation. Simply switching coal-fired power to…
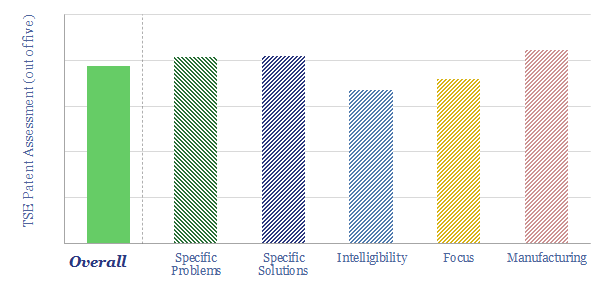
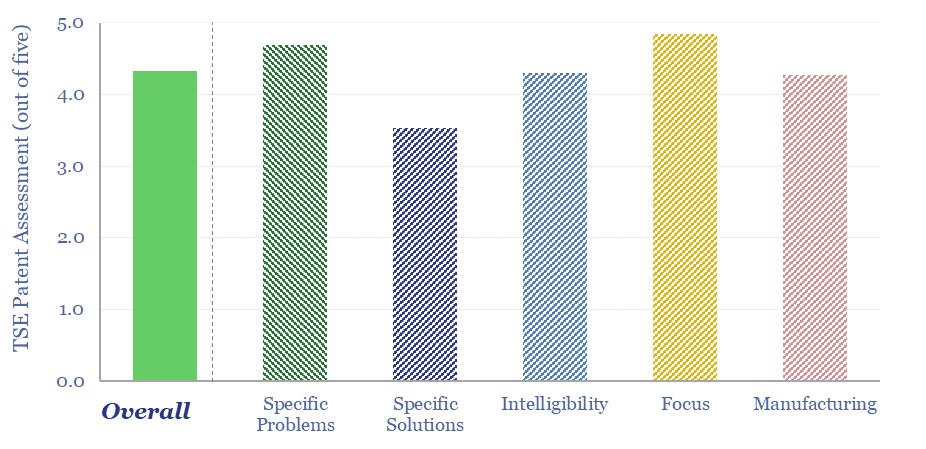
…NET Power addresses the challenges, based on its patents. Can we de-risk Net Power’s technology? Our NET Power technology review shows over ten years of progress, refining the design of…
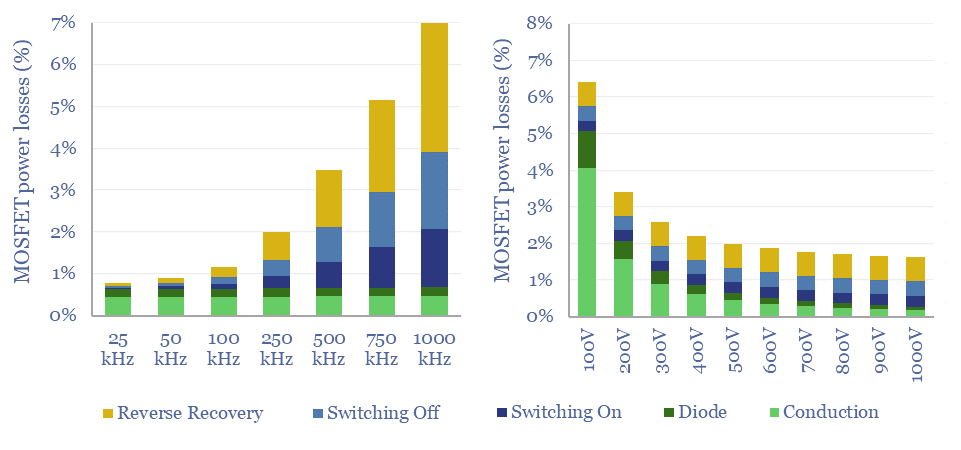
…Formulae for the losses in a power MOSFET? This data-file aims to calculate the power losses of a power MOSFET from first principles, covering I2R conduction losses, voltage drops across…
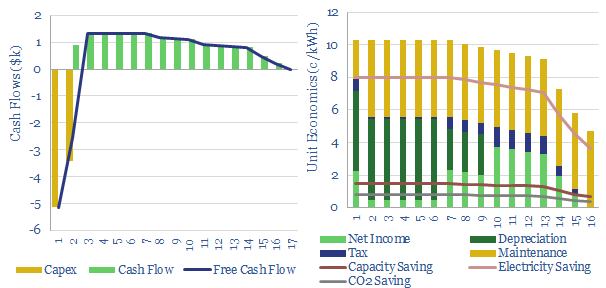
This model captures the economics of power factor correction via installing capacitor banks upstream of inductive loads. $449.00 – Purchase Checkout Added to cart Specifically, these capacitors prevent power drops and unnecessary…
…lack of inertia, reactive power and fault current (notes below). https://thundersaidenergy.com/2021/09/16/power-grids-tenet/ https://thundersaidenergy.com/downloads/power-electronics-problems-and-solutions/ A final issue with wind and solar is that they may see some inflation in their future costs….
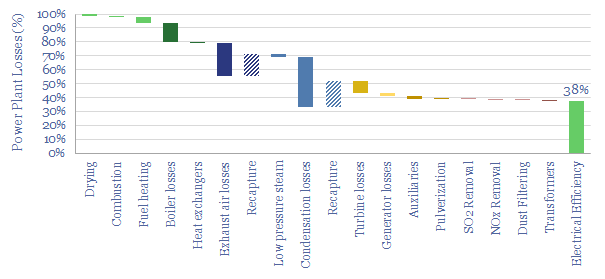
This data-file is a simple loss attribution for a thermal power plant. For example, a typical coal-fired power plant might achieve a primary efficiency of 38%, converting thermal energy in…
…to General Cable’s E3X technology, which has exciting potential for reconductoring transmission lines. E3X is a thin yet durable ceramic coating, with 0.9x emissivity factor and 0.2x solar absorptivity factor,…
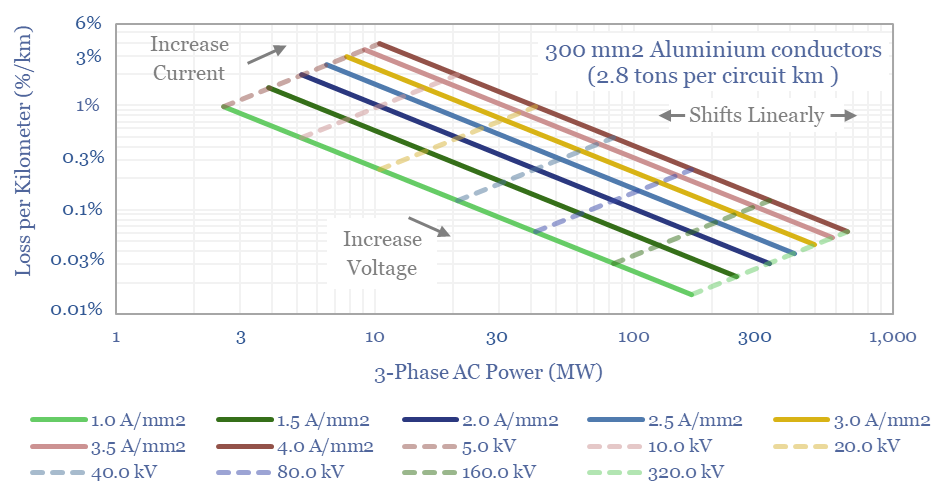
This data-file calculates the power carrying capacity of power cables, plus the resistive losses of power cables. Both are modeled as a function of their voltage, current density, copper and/or…