Search results for: “transmission”
-
Power distribution: the economics?
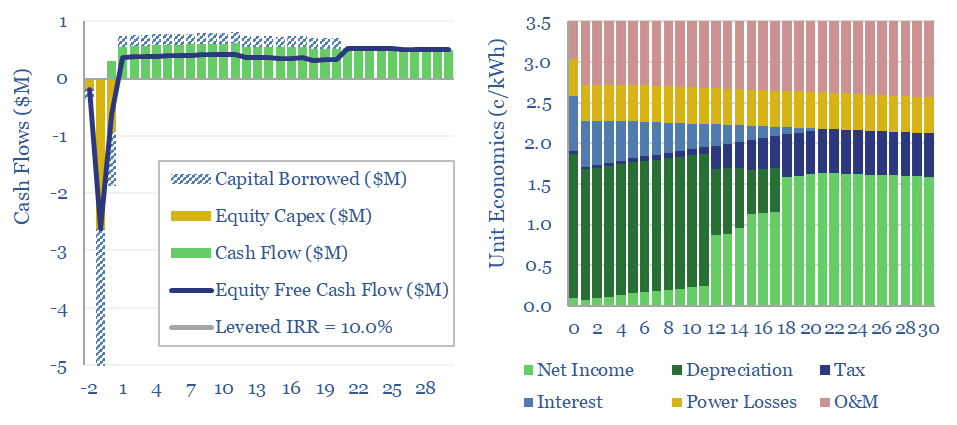
Power distribution costs to residential, commercial and industrial consumers are estimated at 3.5 c/kWh in this model, to generate a 10% levered return, in a 5km x 10MW distribution line, at 17kV, rated up to 400A, with a capex cost of $150/kW-km, a 5% line loss and 40% annualized utilization. All of these inputs can…
-
Photons vs electrons: laser quest?

Some commentators say the 21st century will be the ‘age of the electron’. But in computing/communications, the photon has long been displacing the electron. This 17-page note gives an overview. It matters as moving data is 50-90% of data center energy use. We contrast fiber vs copper; and explore AI power, optical computing, and a…
-
Copper: global demand forecasts?
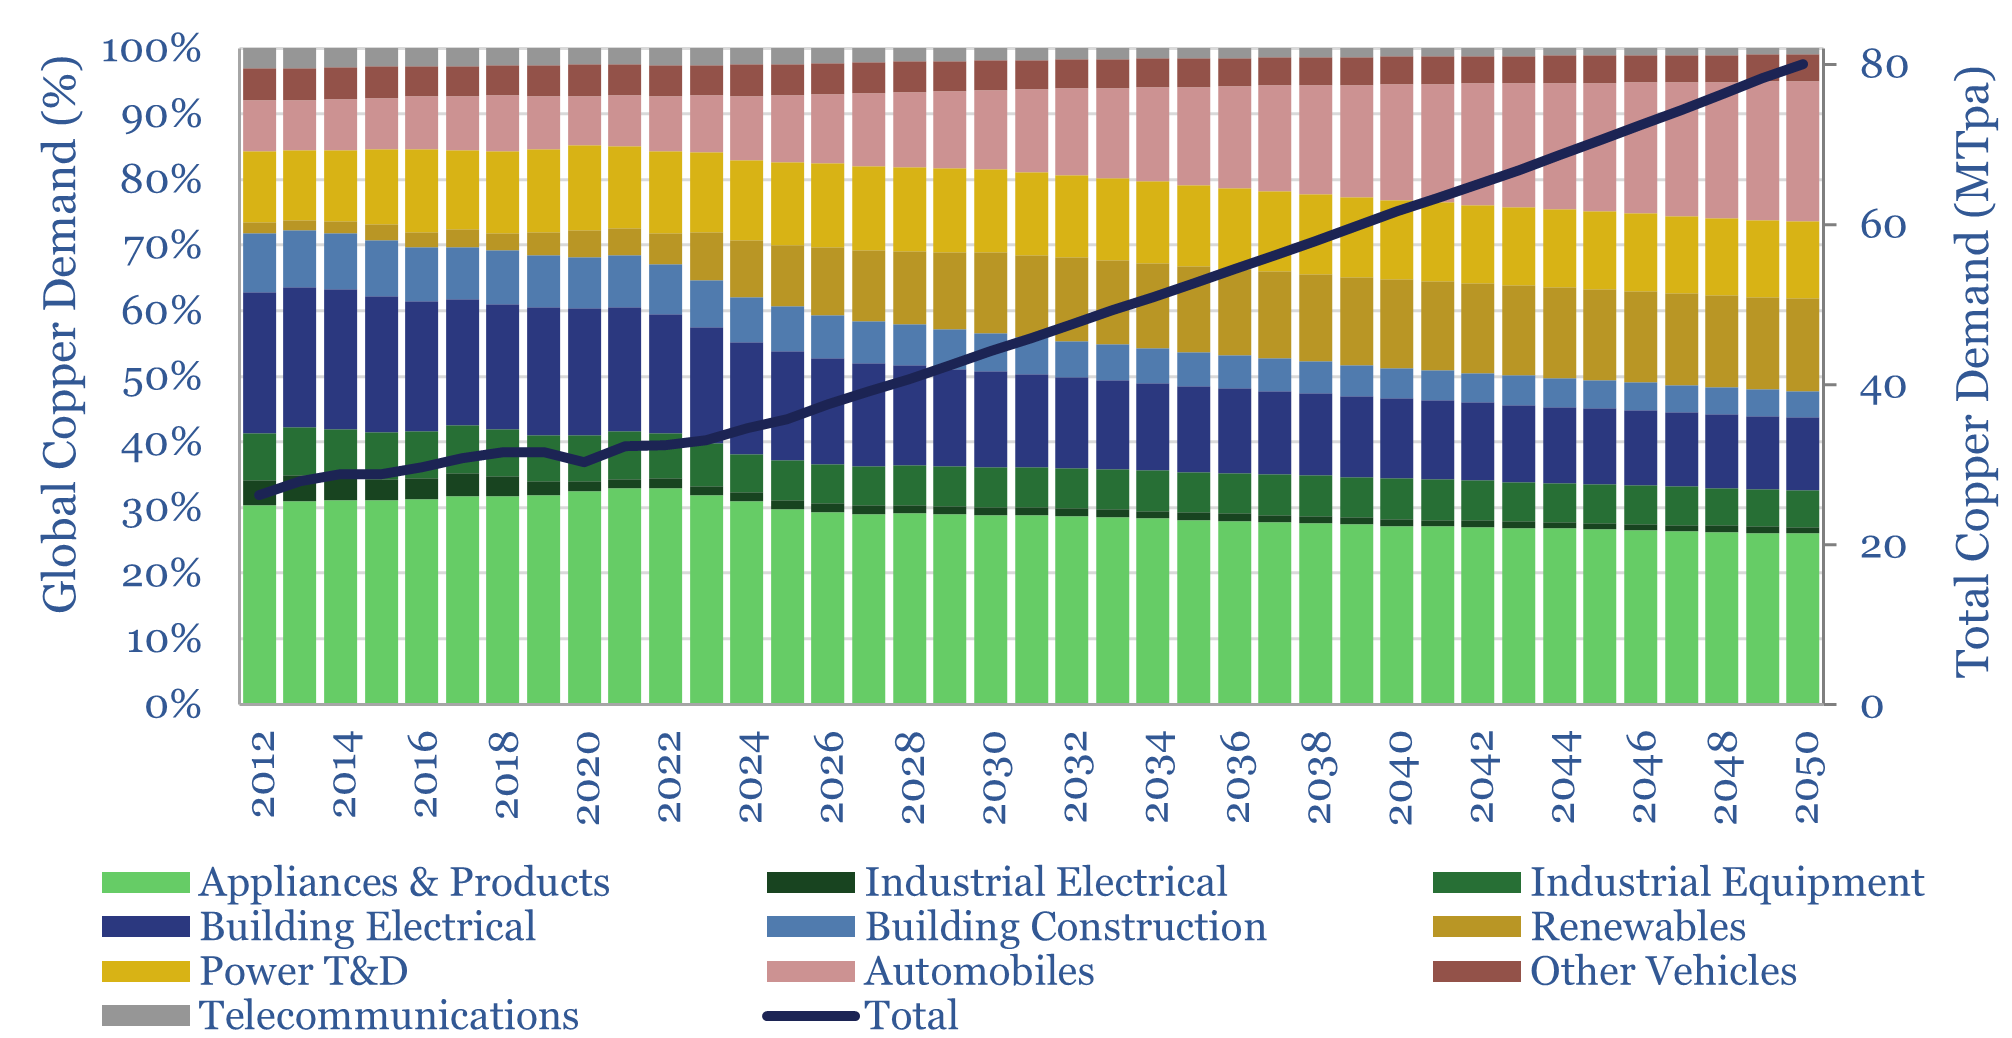
This data-file estimates global copper demand as part of the energy transition, rising from 33MTpa in 2023 to 44MTpa in 2030 and 80MTpa by 2050. Key demand drivers are solar, EVs, greater AC adoption and possibly drones and robotics. You can stress test half-a-dozen key input variables in the model.
-
Power generation: sensitivity to high-temperature heatwaves?

This data-file aims to provide a simple model for how generally well-covered grids can fail catastrophically during a heatwave. We have drawn on technical papers to quantify the deterioration of solar, gas, transmission and distribution losses, wind and other generation sources at higher temperatures.
-
Power grids: global investment?
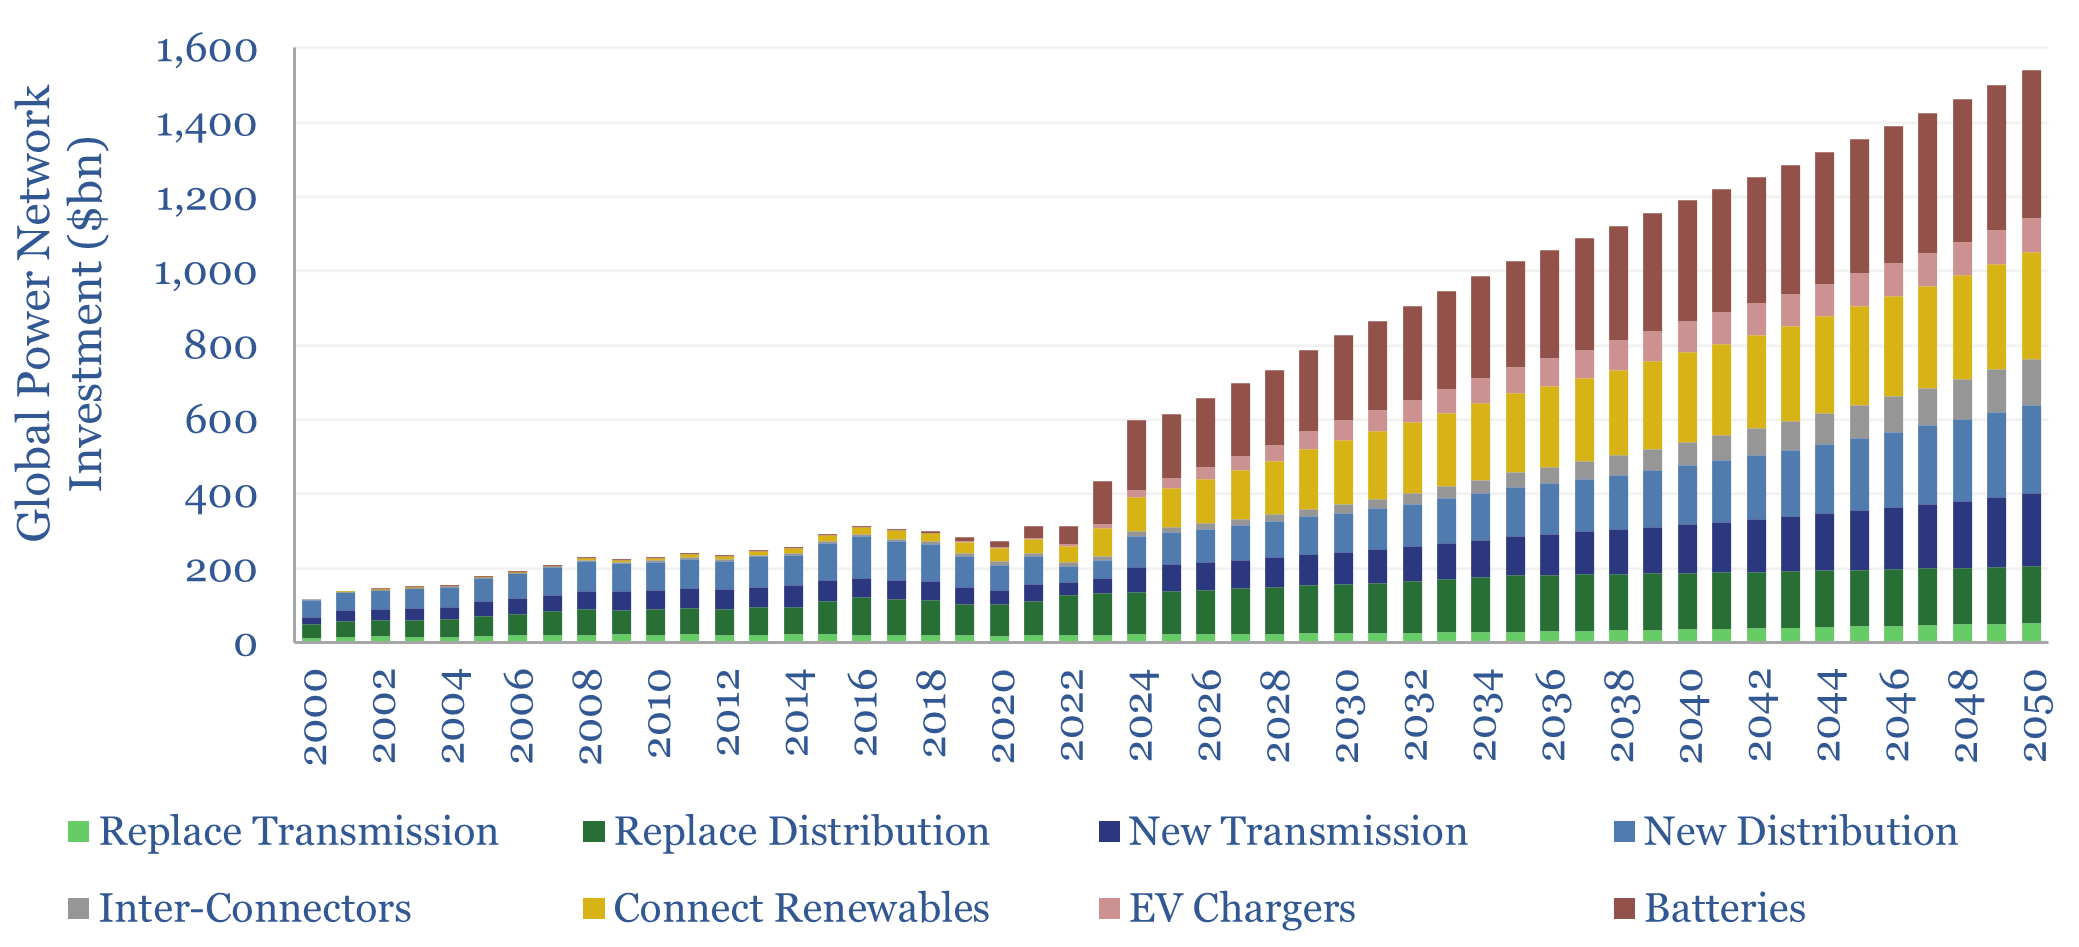
Global investment into power networks averaged $280bn per annum in 2015-20, of which two-thirds was for distribution and one-third was for transmission. Amazingly, these numbers step up to $600bn in 2030, >$1trn in the 2040s and can be as large as all primary energy investment.
-
Power grid bottlenecks: flattening the curve?
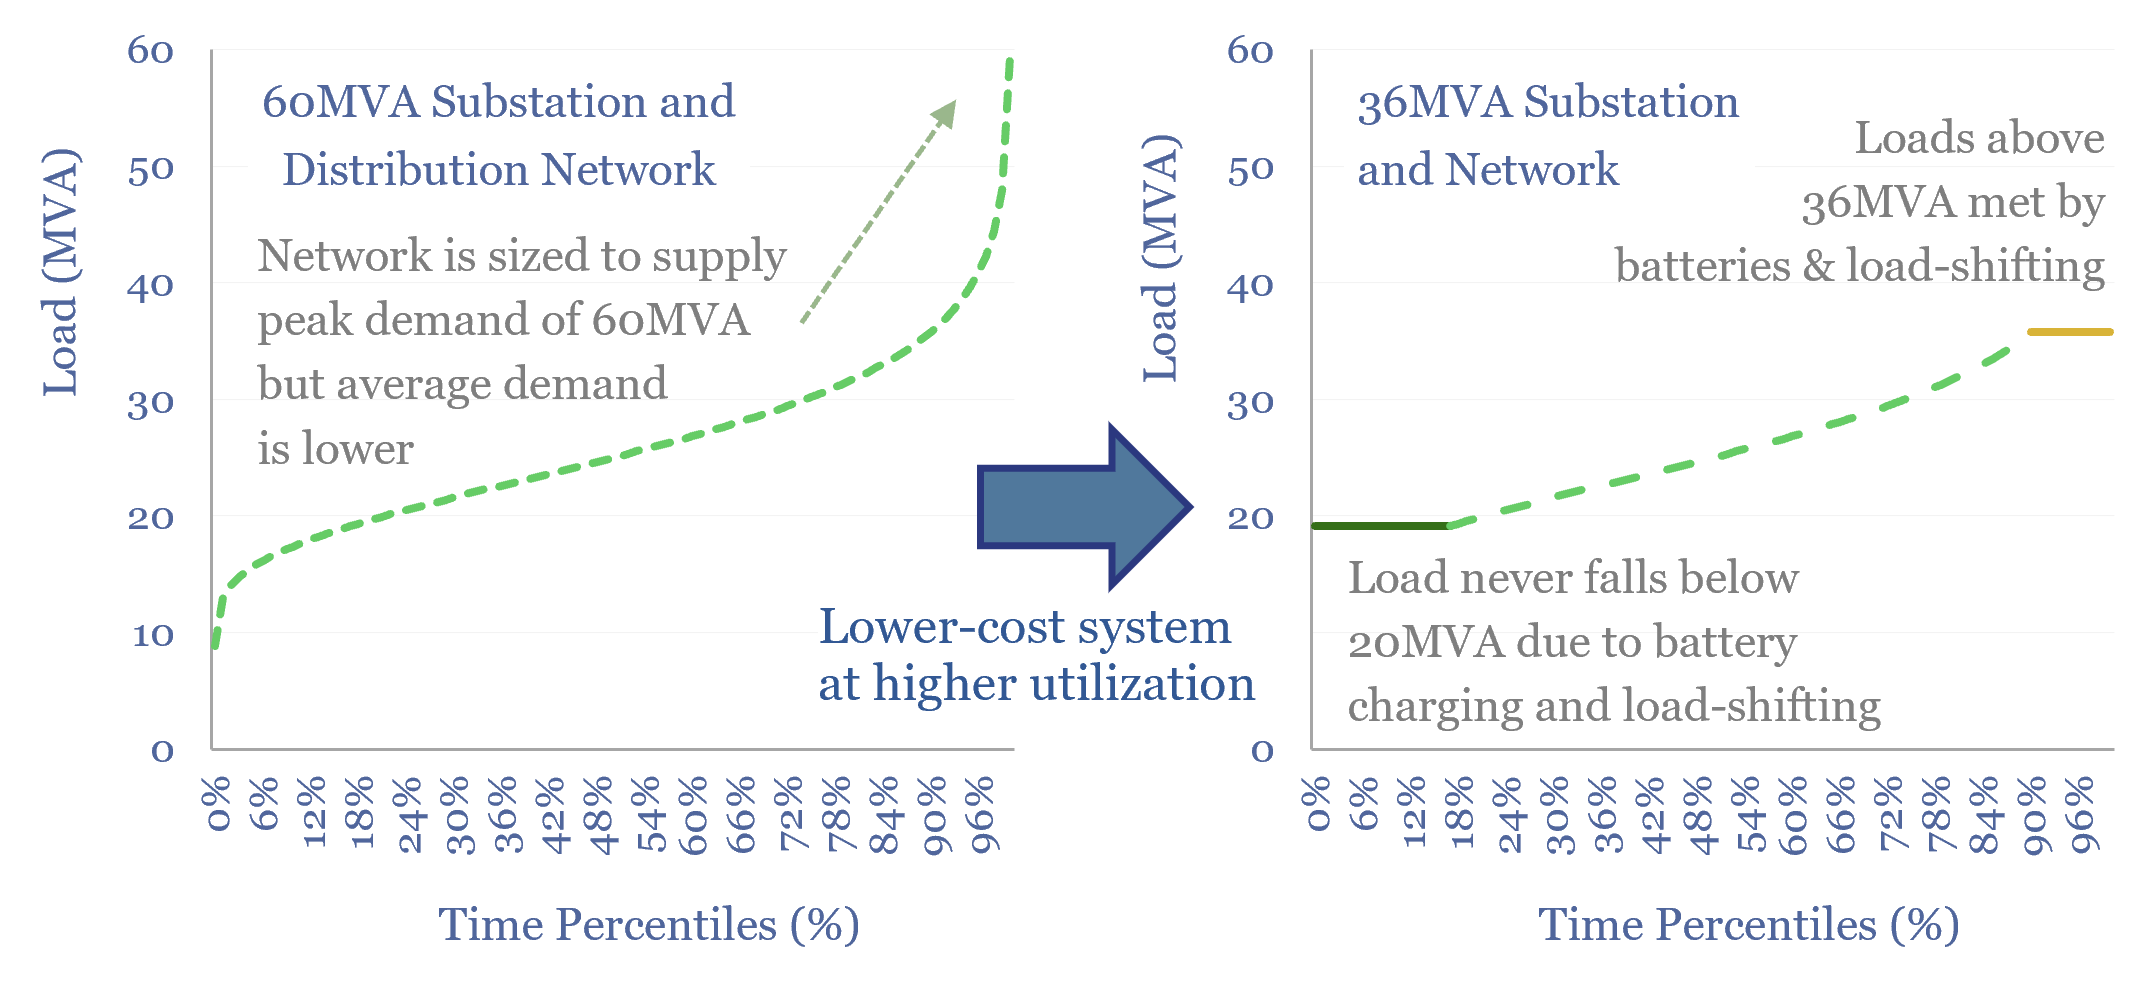
Will persistent grid bottlenecks de-rail electricity growth? This 18-page report explores using batteries and smart energy systems to reduce the need for new power lines. This option can be surprisingly economical, when back-tested on real-world load profiles. Hence we are upgrading our battery outlook.
-
Midstream opportunities in the energy transition?
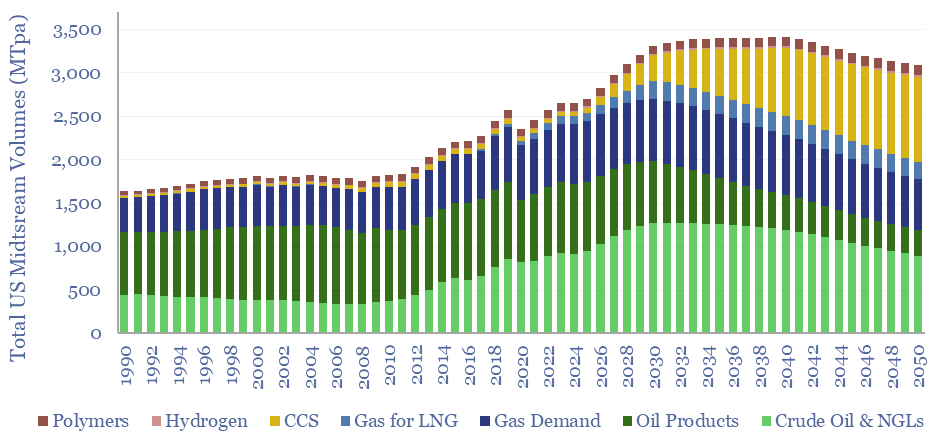
The midstream industry moves molecules, especially energy-molecules, and especially in pipelines. Despite the mega-trend of electrification, there are still strong midstream opportunities in the energy transition, backstopping volatility and moving new molecules. This short note captures our top ten conclusions. (1) Our overall outlook on the US midstream industry sees the total tonnage of molecules…
-
Peak power demand by region (and case studies)

This data-file tracks the timing and magnitude of peak power demand, across different grids in the North Hemisphere, with case studies. This matters for grid-planning, gas peakers and batteries. In the US, peak demand is typically driven by high AC loads in summer heatwaves. In Europe’s milder climate, only c10% of homes have AC, and…
-
Power cuts: how frequent are grid disruptions?
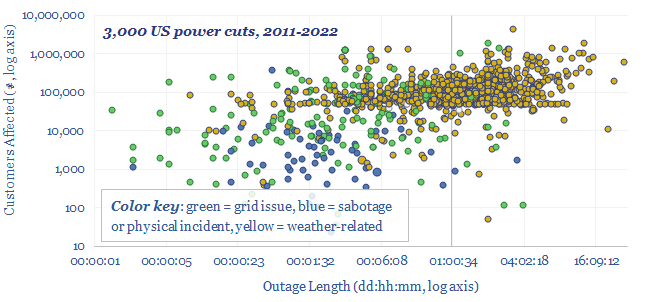
This data-file aggregates significant US power grid disruptions, based on data from the DOE. On average, there are 250 power cuts per year in the United States, lasting for a median average of 5-hours, and affecting a median average of 80,000 customers. 20% of the power cuts last longer than 1-day. 15% affect more than…
-
Energy development times: first consideration to full production?
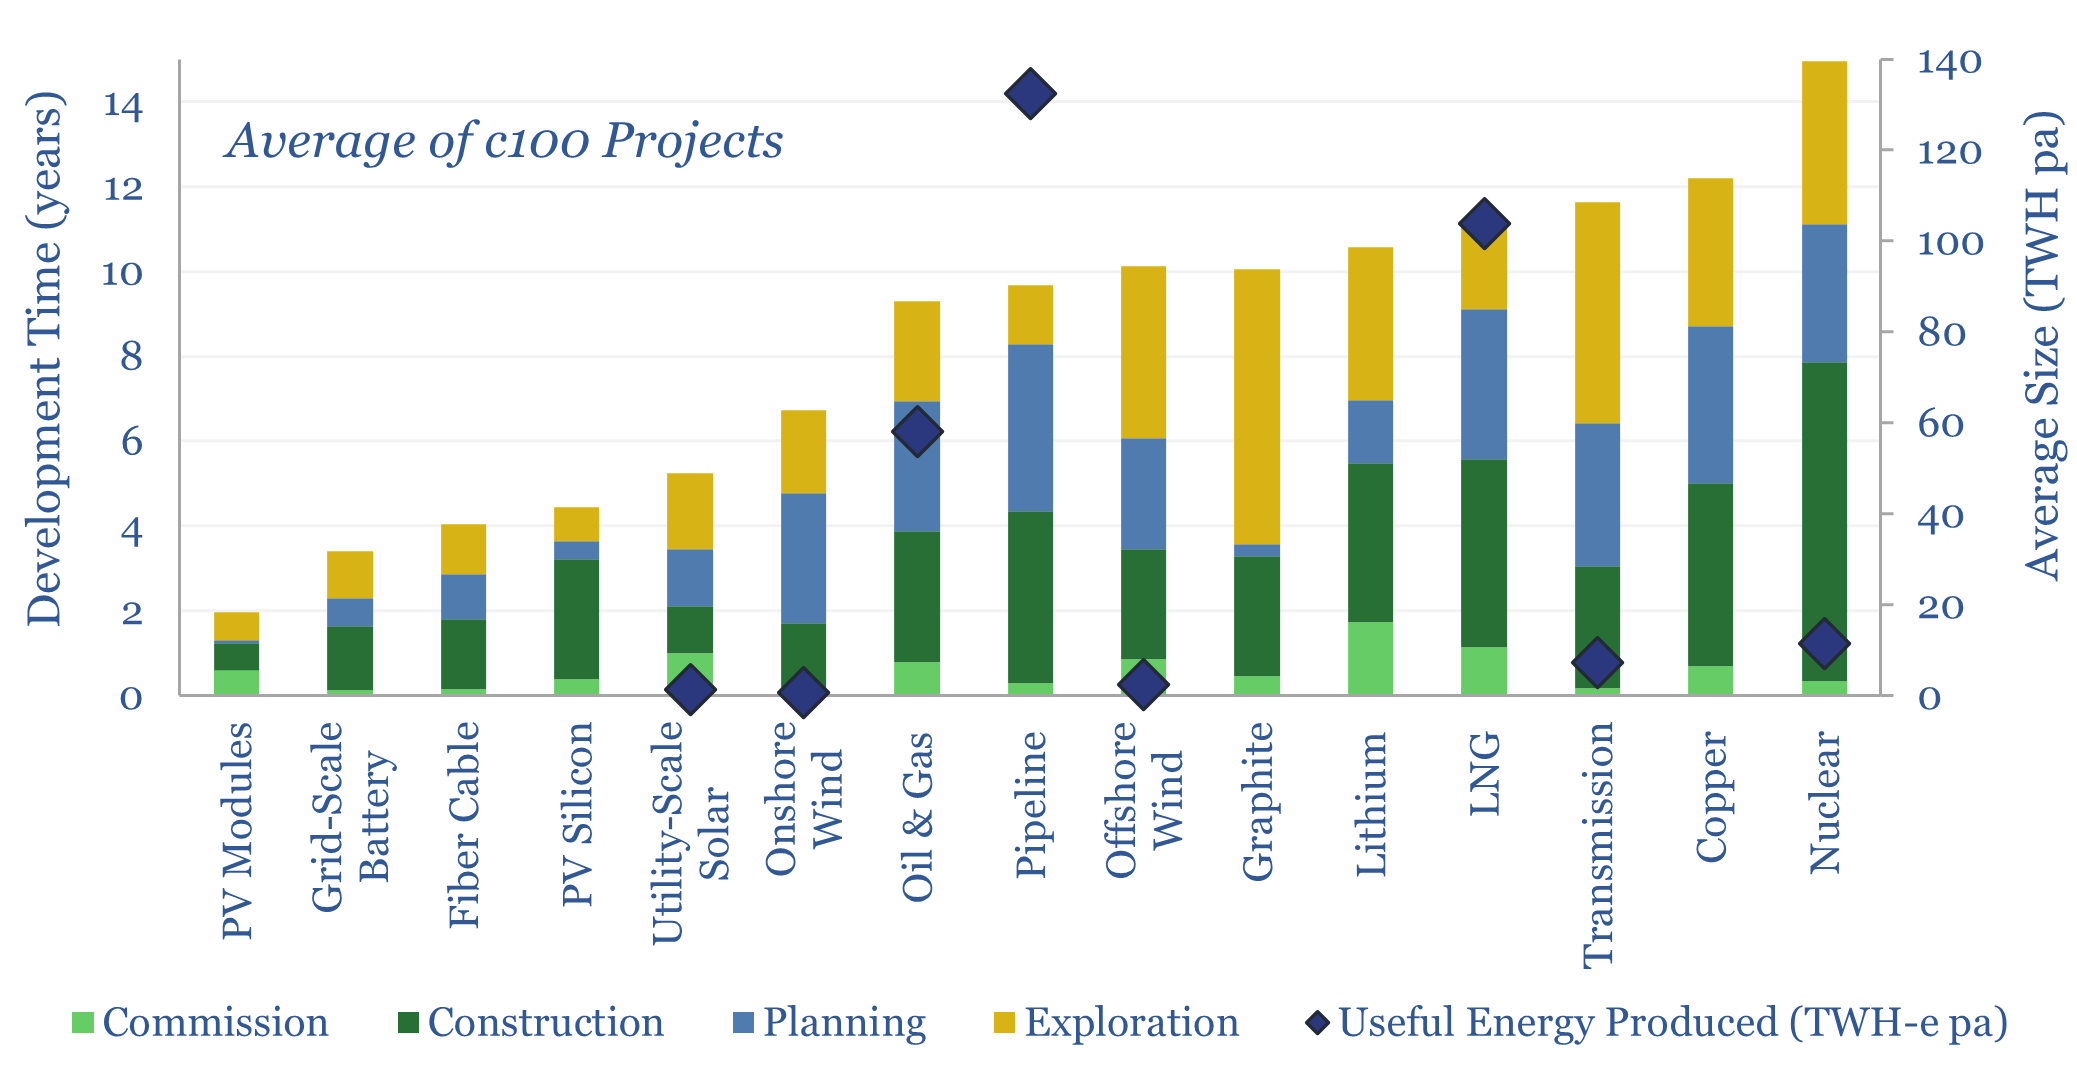
Full cycle development times tend to average c4-years for large solar projects, 6-years for large offshore wind, 7-years for new pipelines, 7-years for new oil and gas projects, 9-years for new LNG plants and 13-years for new nuclear plants. This data-file reviews 35 case studies.
Content by Category
- Batteries (89)
- Biofuels (44)
- Carbon Intensity (49)
- CCS (63)
- CO2 Removals (9)
- Coal (38)
- Company Diligence (95)
- Data Models (840)
- Decarbonization (160)
- Demand (110)
- Digital (60)
- Downstream (44)
- Economic Model (205)
- Energy Efficiency (75)
- Hydrogen (63)
- Industry Data (279)
- LNG (48)
- Materials (82)
- Metals (80)
- Midstream (43)
- Natural Gas (149)
- Nature (76)
- Nuclear (23)
- Oil (164)
- Patents (38)
- Plastics (44)
- Power Grids (130)
- Renewables (149)
- Screen (117)
- Semiconductors (32)
- Shale (51)
- Solar (68)
- Supply-Demand (45)
- Vehicles (90)
- Wind (44)
- Written Research (354)