Search results for: “gas turbine”
-
Leading companies in super-alloys?
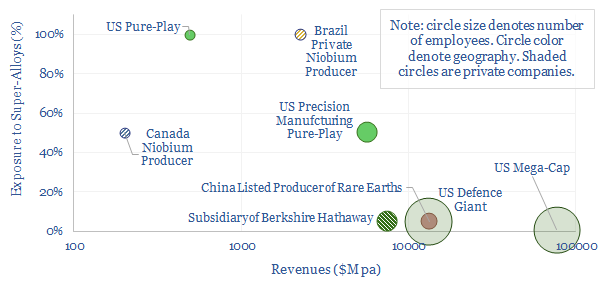
This data-file is a screen of leading companies in super-alloys, covering US pure-plays, mega-caps in industrials and defence, and emerging world producers of Rare Earth metals. In each case, we have included our notes and observations.
-
Gas fractionation: NGL economics?
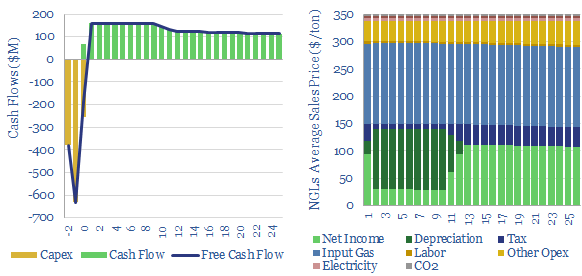
Gas fractionation separates out methane from NGLs such as ethane, propane and butane. A full separation uses up almost 1% of the input gas energy and 4% of the NGL energy. The costs of gas fractionation require a gas processing spread of $0.7/mcf for a 10% IRR off $2/mcf input gas, or in turn, an…
-
Gas distribution: loss rates, leakage, unaccounted gas?
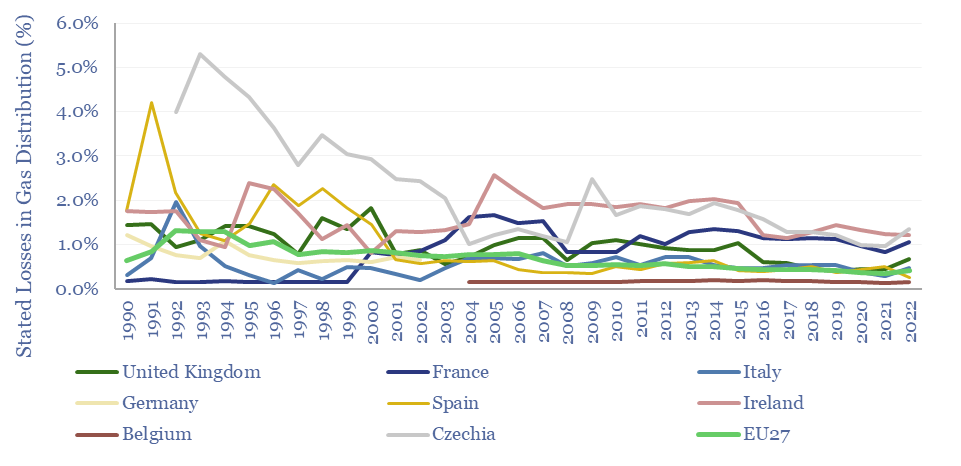
1-4% of all the gas that flows into downstream gas distribution networks may fail to be metered and monetized. Stated leakage rates are usually around 0.5%, but could be higher. This data-file aggregates data from Eurostat and the UK’s Joint Office of Gas Transporters.
-
Compressed air energy storage: costs and economics?
Our base case estimates for Compressed Air Energy Storage costs require a 26c/kWh storage spread to generate a 10% IRR at a $1,350/kW CAES facility, with 63% round-trip efficiency, charging and discharging 365 days per year. Our numbers are based on top-down project data and bottom up calculations, both for CAES capex (in $/kW) and…
-
Gas power: does low utilization entail spare capacity?
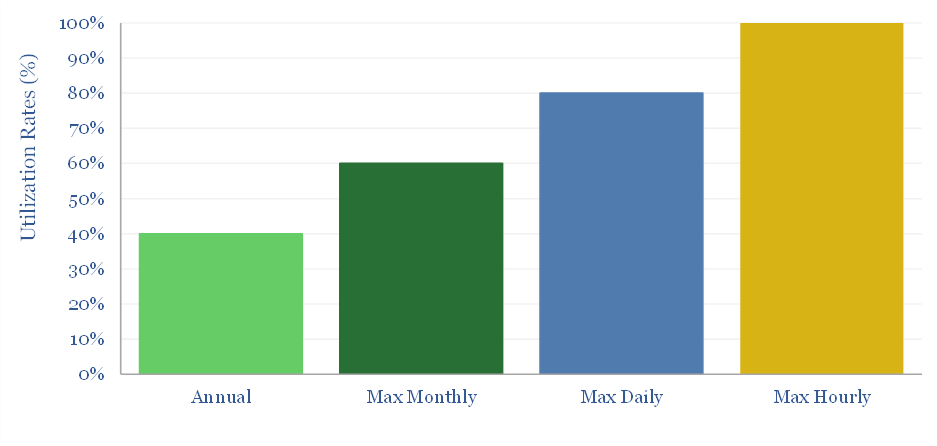
The US has >400GW of large gas-fired power plants running at 40% average annual utilization. Could they help power new loads, e.g., 60GW of AI data-centers by 2030? This 5-page note shows why low utilization does not entail spare capacity, and in turn, estimates the true spare capacity for loads such as data-centers.
-
Power plants: average capacity?
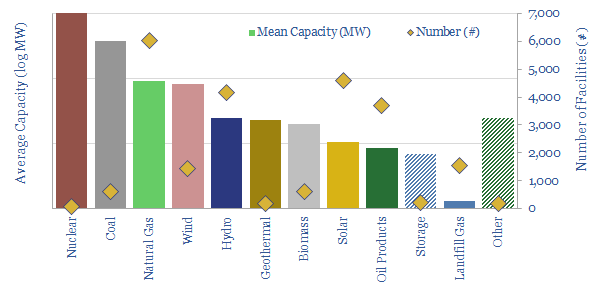
This data-file aggregates granular data into the average capacity of different types of power plants: wind, solar, nuclear, gas, hydro, coal, biomass, landfill gas and geothermal. Energy transition is going to increase the number of inter-connections to the grid by 10-100x.
-
Peak loads: can batteries displace gas peakers?
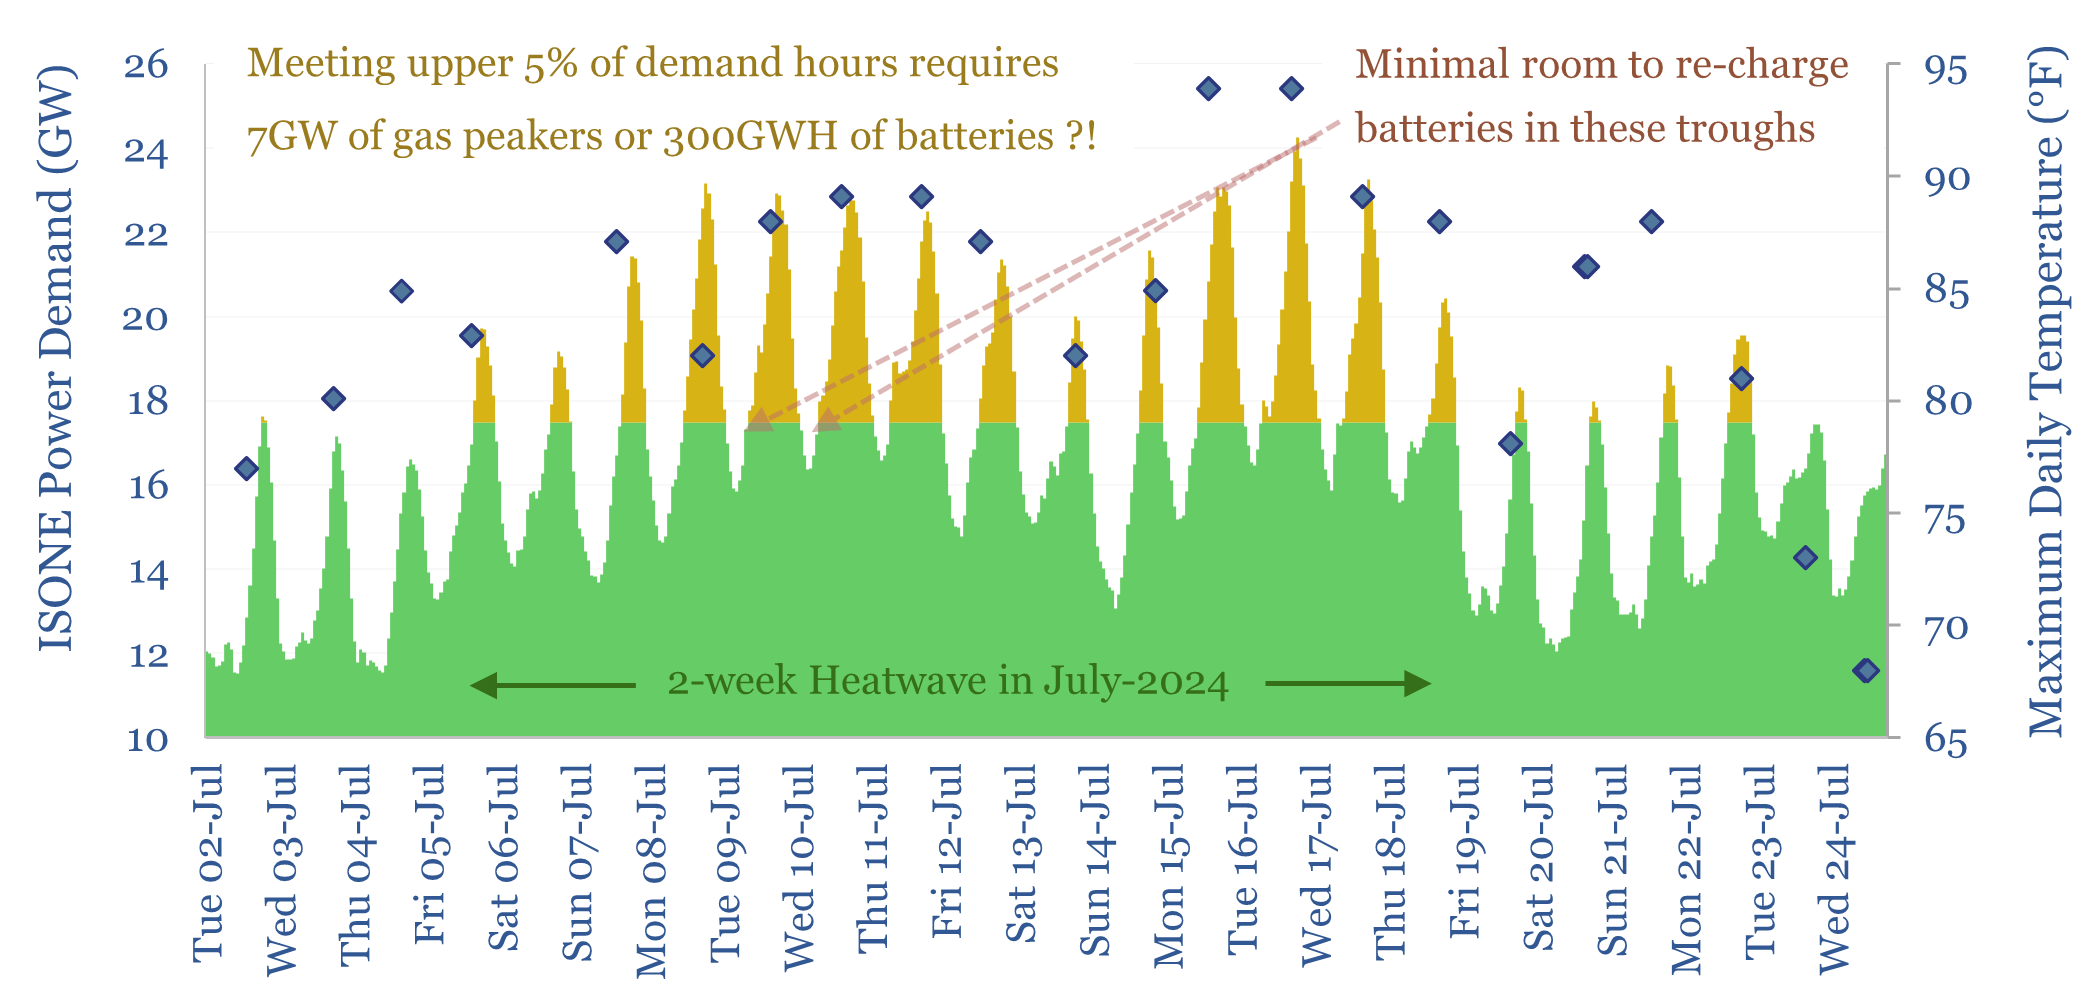
Peak loads in power grids are caused by heatwaves (in the US) and cold snaps (in Europe), which last 2-14 days. This 16-page report finds that very large batteries would be needed to ride through these episodes, costing 2-20x more than gas peakers. But the outlook differs interestingly between the US vs Europe.
-
US gas transmission: by company and by pipeline?
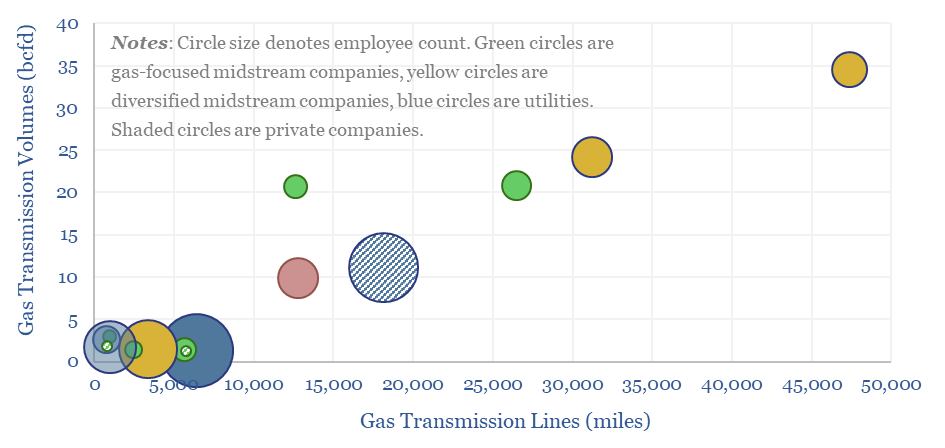
This data-file aggregates granular data into US gas transmission, by company and by pipeline, for 40 major US gas pipelines which transport 45TCF of gas per annum across 185,000 miles; and for 3,200 compressors at 640 related compressor stations.
-
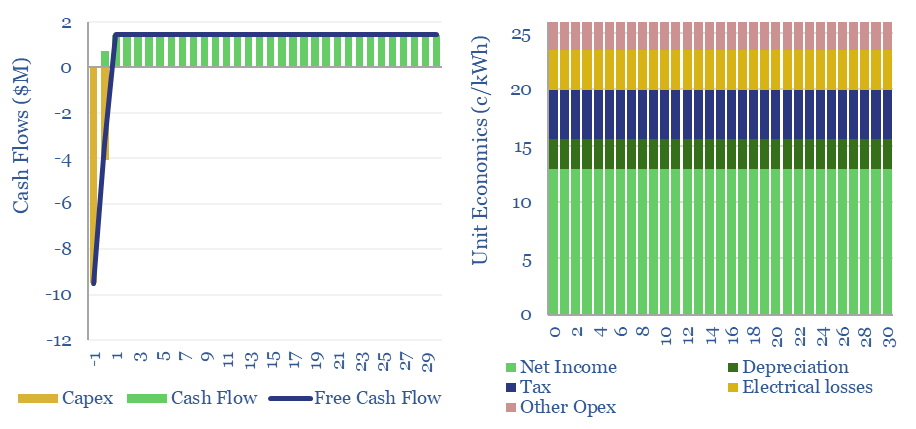
Fast-charge the electric vehicles with gas?
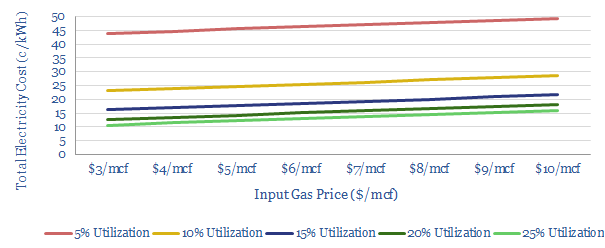
There is upside for natural gas, as EV penetration rises: we model that gas turbines can economically power fast-chargers for 13c/kWh. Carbon emissions are lowered by c70% compared with oil. And the grid is spared from power demand surges. Download our data-file to stress-test the sensitivities.
-
European gas and power model: natural gas supply-demand?
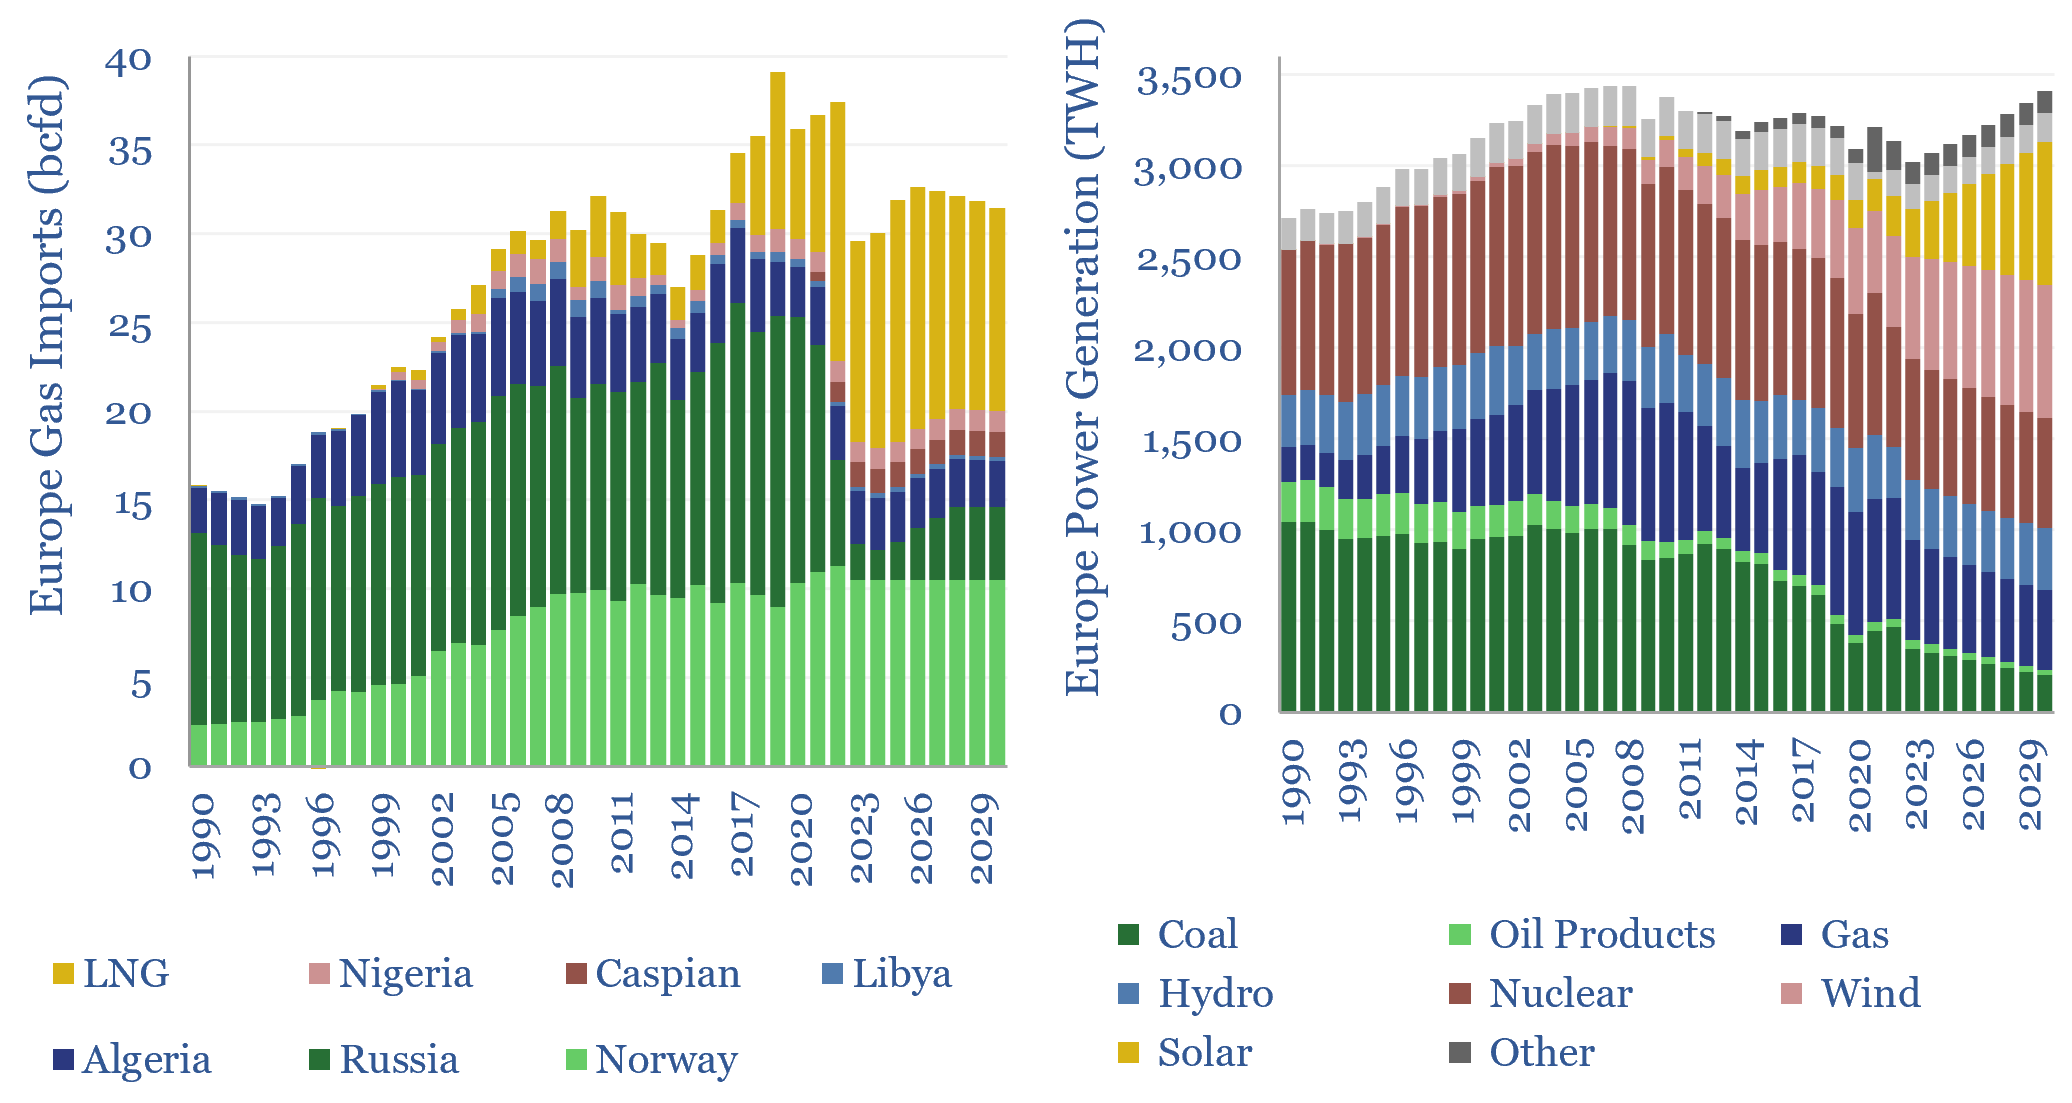
European gas and power markets will look better-supplied than they truly are in 2023-24. A dozen key input variables can be stress-tested in the data-file. Overall, we think Europe will need to source over 15bcfd of LNG through 2030, especially US LNG.
Content by Category
- Batteries (89)
- Biofuels (44)
- Carbon Intensity (49)
- CCS (63)
- CO2 Removals (9)
- Coal (38)
- Company Diligence (94)
- Data Models (838)
- Decarbonization (160)
- Demand (110)
- Digital (59)
- Downstream (44)
- Economic Model (204)
- Energy Efficiency (75)
- Hydrogen (63)
- Industry Data (279)
- LNG (48)
- Materials (82)
- Metals (80)
- Midstream (43)
- Natural Gas (148)
- Nature (76)
- Nuclear (23)
- Oil (164)
- Patents (38)
- Plastics (44)
- Power Grids (130)
- Renewables (149)
- Screen (117)
- Semiconductors (32)
- Shale (51)
- Solar (68)
- Supply-Demand (45)
- Vehicles (90)
- Wind (44)
- Written Research (354)