Search results for: “truck trucks”
-
Drone Delivery: the Energy Economics
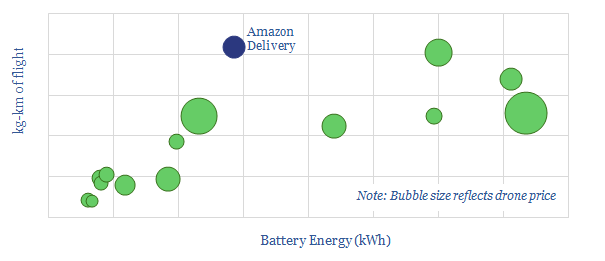
We have tabulated energy economics on 15 commercial drones and run the equations of flight on Amazon’s “Prime Air” solution. We conclude that drone delivery will use 90% less energy, 99% less cost and 90% lower carbon than is typical in current last-mile truck deliveries. Please download the model for all of the numbers.
-
Proton exchange membrane fuel cells: what challenges?
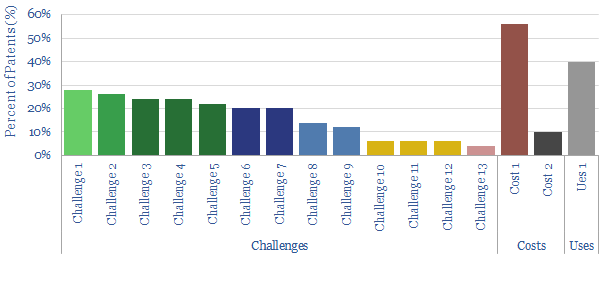
This data-file reviews fifty patents into proton exchange membrane fuel cells, filed by leading companies in the space in 2020, in order to understand the key challenges the industry is striving to overcome. The key focus areas are controlling temperature, humidity and longevity, but unfortunately this will tend to increase costs.
-
Lithium ion batteries for electric vehicles: what challenges?
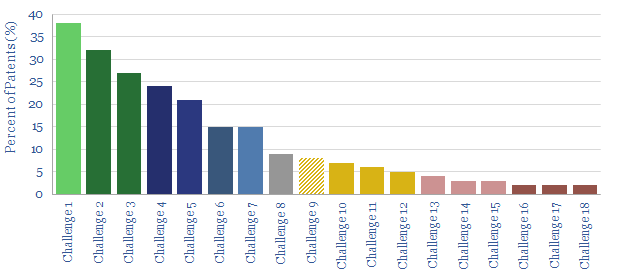
This data-file tabulates the greatest challenges for lithium ion batteries in electric vehicles, which have been cited in 2020’s patent literature. Conclusions are spelled out in detail, covering energy density, “million mile” longevity and electric semi-trucks. Companies profiled include Tesla, CATL, LG, Sumitomo, et al.
-
Vehicle depreciation rates: EVs versus ICEs?
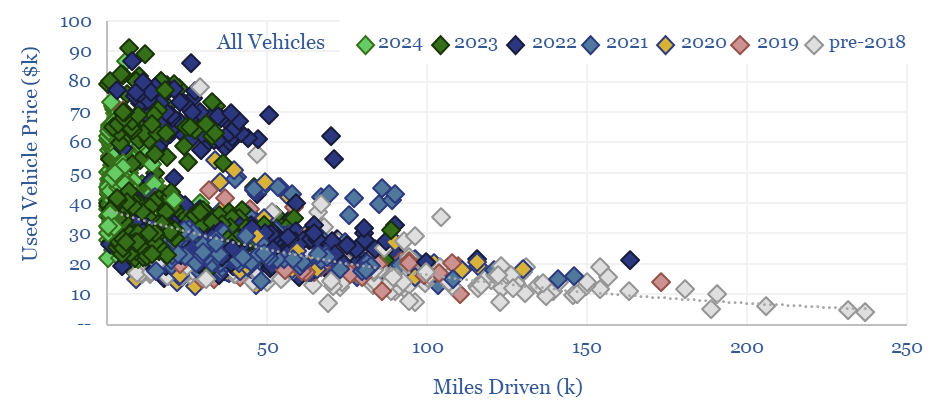
This data-file quantifies the cost per mile of vehicle ownership across different categories by correlating second hand car prices with their accumulated mileage. Hybrids and regular passenger cars are most economical. SUVs and EVs are 2x more expensive. Hydrogen vehicles depreciate fastest and will have lost over 90% of their value after 100,000 miles.
-
Hydrogen: lost in transportation?
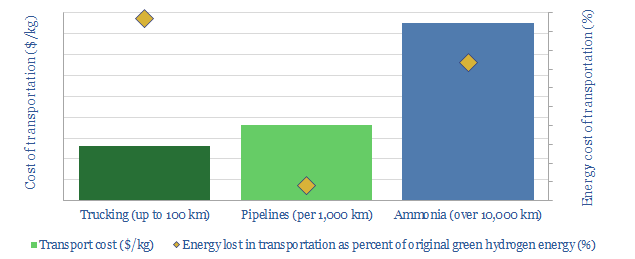
Transporting hydrogen will be more challenging than any other energy commodity ever commercialised. This 19-page note reviews the costs and complexities of cryogenic trucks, pipelines and chemical carriers (e.g., ammonia). Midstream costs will be 2-10x higher than natural gas, while up to 50% of hydrogen’s embedded energy may be lost in transit.
-
Global oil demand forecasts: by end use, by product, by region?
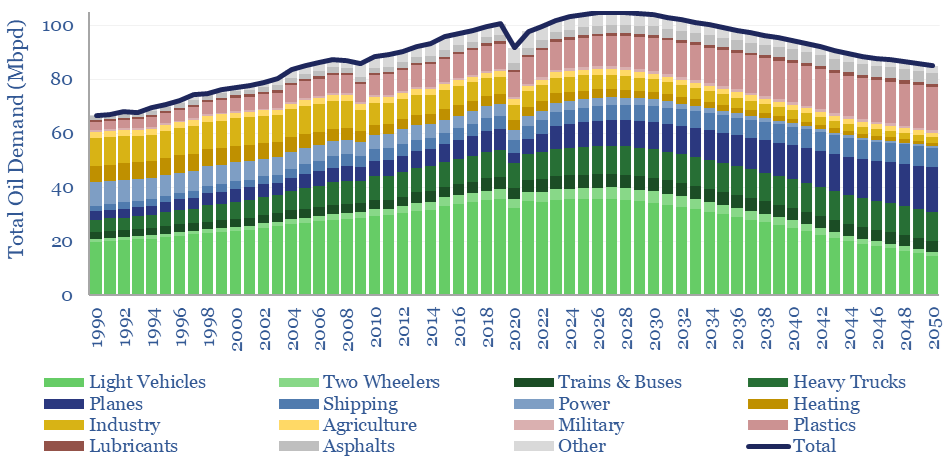
This model forecasts long-run oil demand to 2050, by end use, by year, and by region; across the US, the OECD and the non-OECD. We see demand gently rising through the 2020s, peaking at 105Mbpd in 2026-28, then gently falling to 85Mbpd by 2050 in the energy transition.
-
CO2 disposal in geologic formations: the economics?
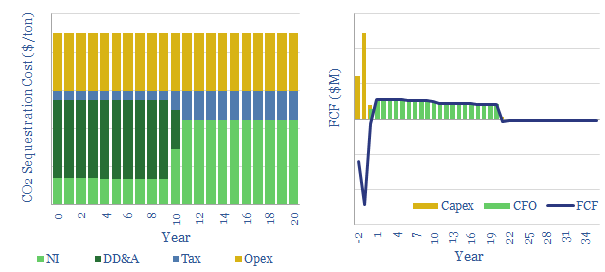
Costs of disposing of CO2 are extremely variable and project-dependent, ranging from $5-50/ton, with a base case of $22.5/ton. This is the disposal price needed to earn a 10% post-tax IRR, transporting, injecting and monitoring CO2 in the subsurface.
-
CO2 intensity of coal production?
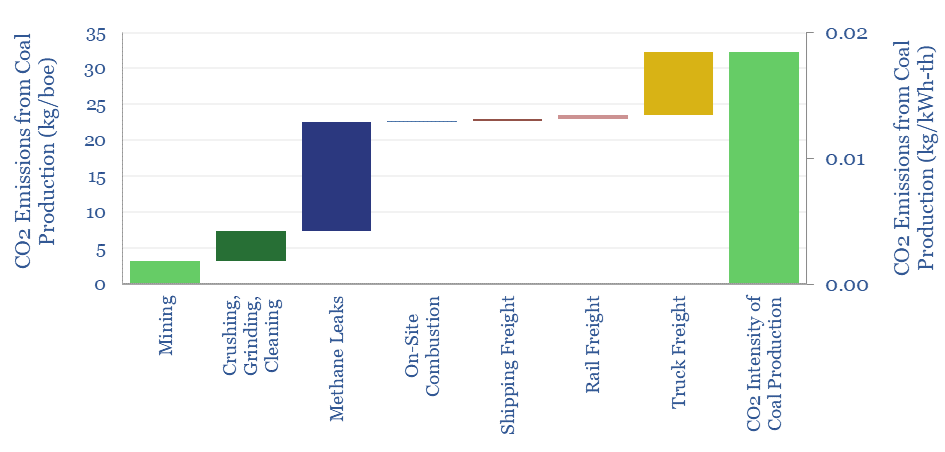
Producing a ton of coal typically emits 0.19T of CO2, equivalent to 50kg/boe. The numbers comprise mining, methane leaks and transportation. Hence domestic coal production will tend to emit 2x more CO2 than gas production, plus c2x more CO2 in combustion. However, numbers vary widely based on input assumptions, such as methane lakage rates, btu content…
-
Oil Sands CO2 Intensity
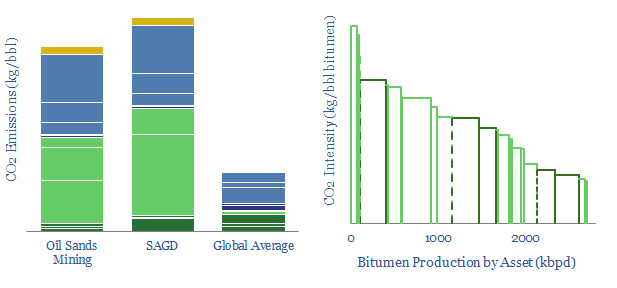
This data-file quantifies the CO2 intensity of oil sands mining and SAGD, line by line, based on real-world data. We also derive a CO2 curve ranking c2.5Mbpd of production across Alberta, to compare different operators. Steam-oil-ratios explain c60% of the variance in SAGD assets’ emissions.
-
Global CO2 emissions breakdown?
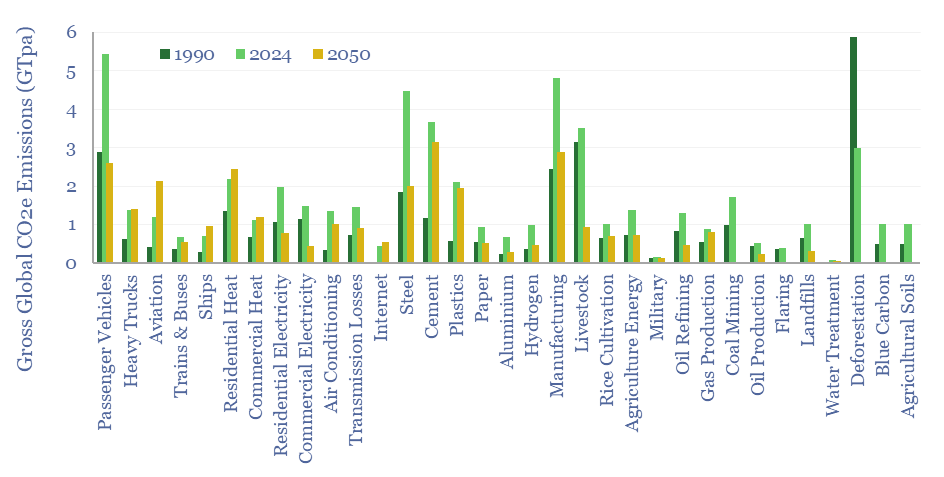
Global CO2 emissions rose from 32GTpa of CO2-equivalents in 1990 to 54GTpa in 2024, and are seen optimistically declining to 30GTpa by 2050, on a gross basis. This global CO2 emisisons breakdown covers 33 sources that each explain over 0.5% of global CO2e emissions, as a way of tracking emissions by source, by year, and…
Content by Category
- Batteries (89)
- Biofuels (44)
- Carbon Intensity (49)
- CCS (63)
- CO2 Removals (9)
- Coal (38)
- Company Diligence (94)
- Data Models (838)
- Decarbonization (160)
- Demand (110)
- Digital (59)
- Downstream (44)
- Economic Model (204)
- Energy Efficiency (75)
- Hydrogen (63)
- Industry Data (279)
- LNG (48)
- Materials (82)
- Metals (80)
- Midstream (43)
- Natural Gas (148)
- Nature (76)
- Nuclear (23)
- Oil (164)
- Patents (38)
- Plastics (44)
- Power Grids (130)
- Renewables (149)
- Screen (117)
- Semiconductors (32)
- Shale (51)
- Solar (68)
- Supply-Demand (45)
- Vehicles (90)
- Wind (44)
- Written Research (354)