Search results for: “demand”
-
Explaining US gasoline?
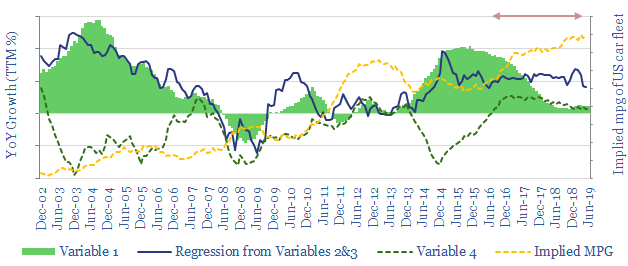
Gasoline demand is stalling in summer-2019, down -0.4% YoY vs a prior 15-year trend for 0.4% pa growth. The cause is urban Vehicle Miles Driven, which has slowed 1.4pp, defying historical correlations with GDP and gasoline prices. Possible structural explanations are explored. The full data-file contains monthly data on the drivers of gasoline, going back…
-
Scaling Up Renewables and Batteries
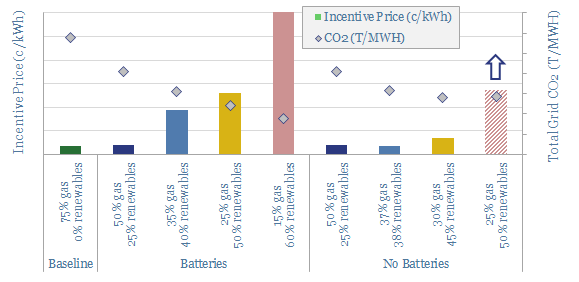
Renewables would cap out at 40-50% of inflexible electricity grids, based on Monte Carlo analysis of wind, solar and batteries. Beyond 50%, new renewables’ curtailment rates surpass 70%, trebling their marginal cost. Batteries also increase incentive prices by 5-25x. Natural gas and demand-shifting are the best backstops.
-
US vehicle ownership and fuel economy?
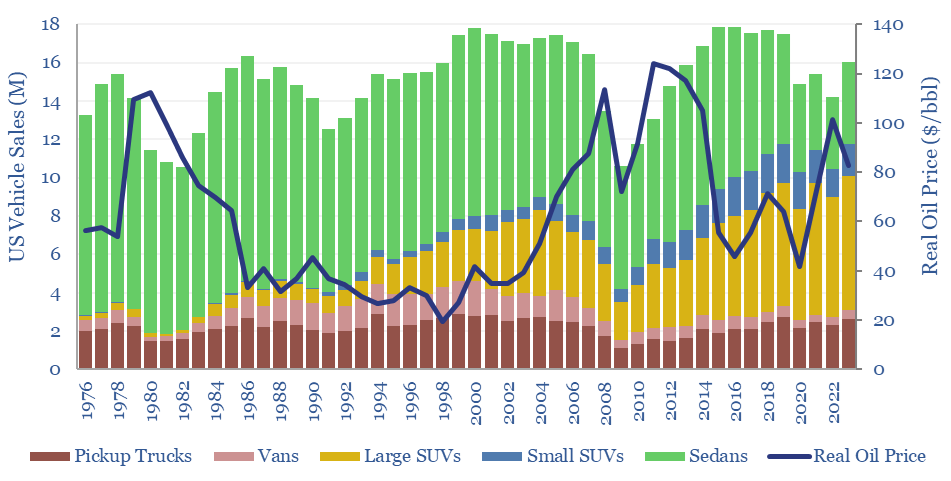
This data file assesses US vehicle ownership over time. Improving fuel economy has been muted by rebound effects, such as greater mobility and larger vehicles. Oil prices influence the types of vehicles being purchased, their masses and their fuel economy. EV ownership has also been rising and is cross-plotted against incomes and other variables.
-
Smart Energy: technology leaders?
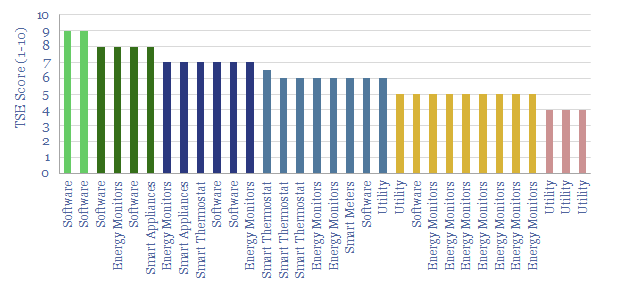
Smart meters and smart devices are capable of transmitting and receiving real-time consumption data and instructions. This data-file tracks 40 leading companies, mostly at the venture and growth stages. They help lower demand, smooth grid volatility and encourage appliance upgrades.
-
US industrial furnaces: breakdown by size, by industry, by fuel?
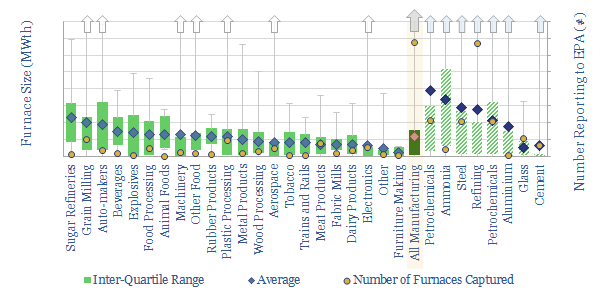
There are 1,500 industrial furnaces in the US manufacturing sector, with average capacity of 60MWth, c90% powered by natural gas, and thus explaining over 3.5 bcfd of US gas demand (4-5% of total). This is an unbelievably complex landscape, but we have captured as much facility-by-facility data as possible.
-
Power generation: sensitivity to high-temperature heatwaves?

This data-file aims to provide a simple model for how generally well-covered grids can fail catastrophically during a heatwave. We have drawn on technical papers to quantify the deterioration of solar, gas, transmission and distribution losses, wind and other generation sources at higher temperatures.
-
Falling towers: how will energy shortages play out?
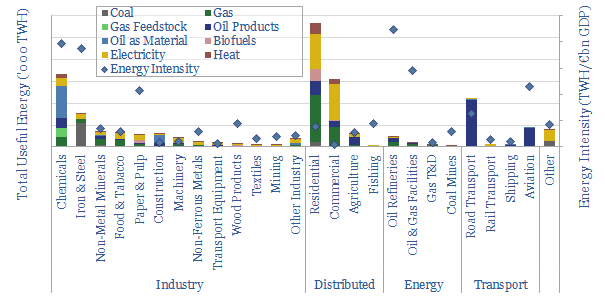
If global energy supplies run short, then someone has to curtail demand. Europe is in the firing line, with 7% of the world’s people, using 17% of its energy, of which 65% is imported. So this 13-page note searches for the least bad options to cut European energy demand. Energy intensive industries may shutter and…
-
Silver producers: leading companies?
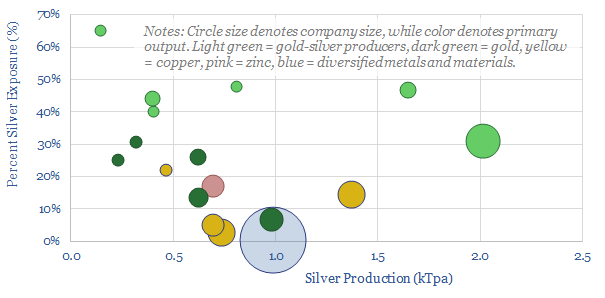
Half of the world’s 28kTpa global silver market is controlled by 17 public companies, with silver output ranging from 0.1 – 2.0 kTpa, and co-producing gold, copper or other metals. This data-file is a screen of silver producers, in order to identify leading companies.
-
What is the energy consumption of the internet?
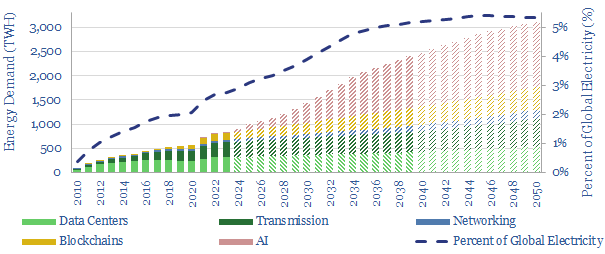
Powering the internet consumed 800 TWH of electricity in 2022, as 5bn users generated 4.7 Zettabytes of traffic. Our guess is that the internet’s energy demands double by 2030, including due to AI (e.g., ChatGPT), adding 1% upside to global energy and 2.5% to global electricity demand. This 13-page note aims to break down the…
-
Jevons Paradox: what evidence for energy savings?
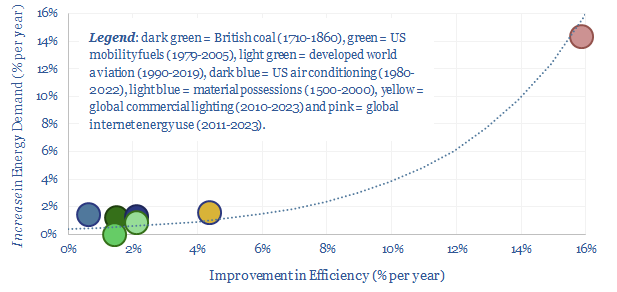
Using a commodity more efficiently can cause its demand to rise not fall; as greater efficiency opens up unforeseen possibilities. This is Jevon’s Paradox. Our 16-page report finds it is more prevalent than we expected. Efficiency gains underpin 25% of our roadmap to net zero. To be effective, commodity prices must also rise and remain…
Content by Category
- Batteries (89)
- Biofuels (44)
- Carbon Intensity (49)
- CCS (63)
- CO2 Removals (9)
- Coal (38)
- Company Diligence (94)
- Data Models (838)
- Decarbonization (160)
- Demand (110)
- Digital (59)
- Downstream (44)
- Economic Model (204)
- Energy Efficiency (75)
- Hydrogen (63)
- Industry Data (279)
- LNG (48)
- Materials (82)
- Metals (80)
- Midstream (43)
- Natural Gas (148)
- Nature (76)
- Nuclear (23)
- Oil (164)
- Patents (38)
- Plastics (44)
- Power Grids (130)
- Renewables (149)
- Screen (117)
- Semiconductors (32)
- Shale (51)
- Solar (68)
- Supply-Demand (45)
- Vehicles (90)
- Wind (44)
- Written Research (354)