Search results for: “renewables”
-
Patent Leaders in Energy
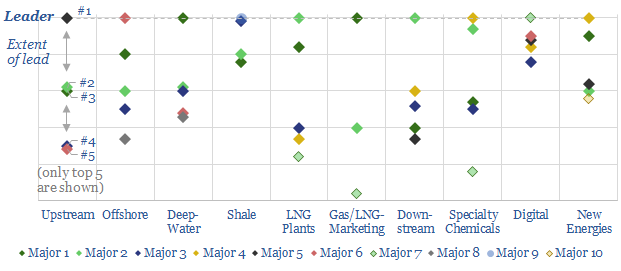
Technology leadership is crucial in energy. But it is difficult to discern. Hence, we reviewed 3,000 patents across the 25 largest companies. This note ranks the industry’s “Top 10 technology-leaders”: in upstream, offshore, deep-water, shale, LNG, gas-marketing, downstream, chemicals, digital and renewables. In each case, we profile the leading company, its edge and the proximity…
-
Global LNG supply model: by project and by country?

Global LNG output ran at 406MTpa in 2024. This model estimates global LNG production by facility across 150 LNG facilities. Our latest forecasts are that global LNG demand will rise at a 6% CAGR, to reach 710MTpa by 2035, for an absolute growth rate of +30MTpa per year, but there is a supply-crunch in 2024-26,…
-
European gas and power model: natural gas supply-demand?
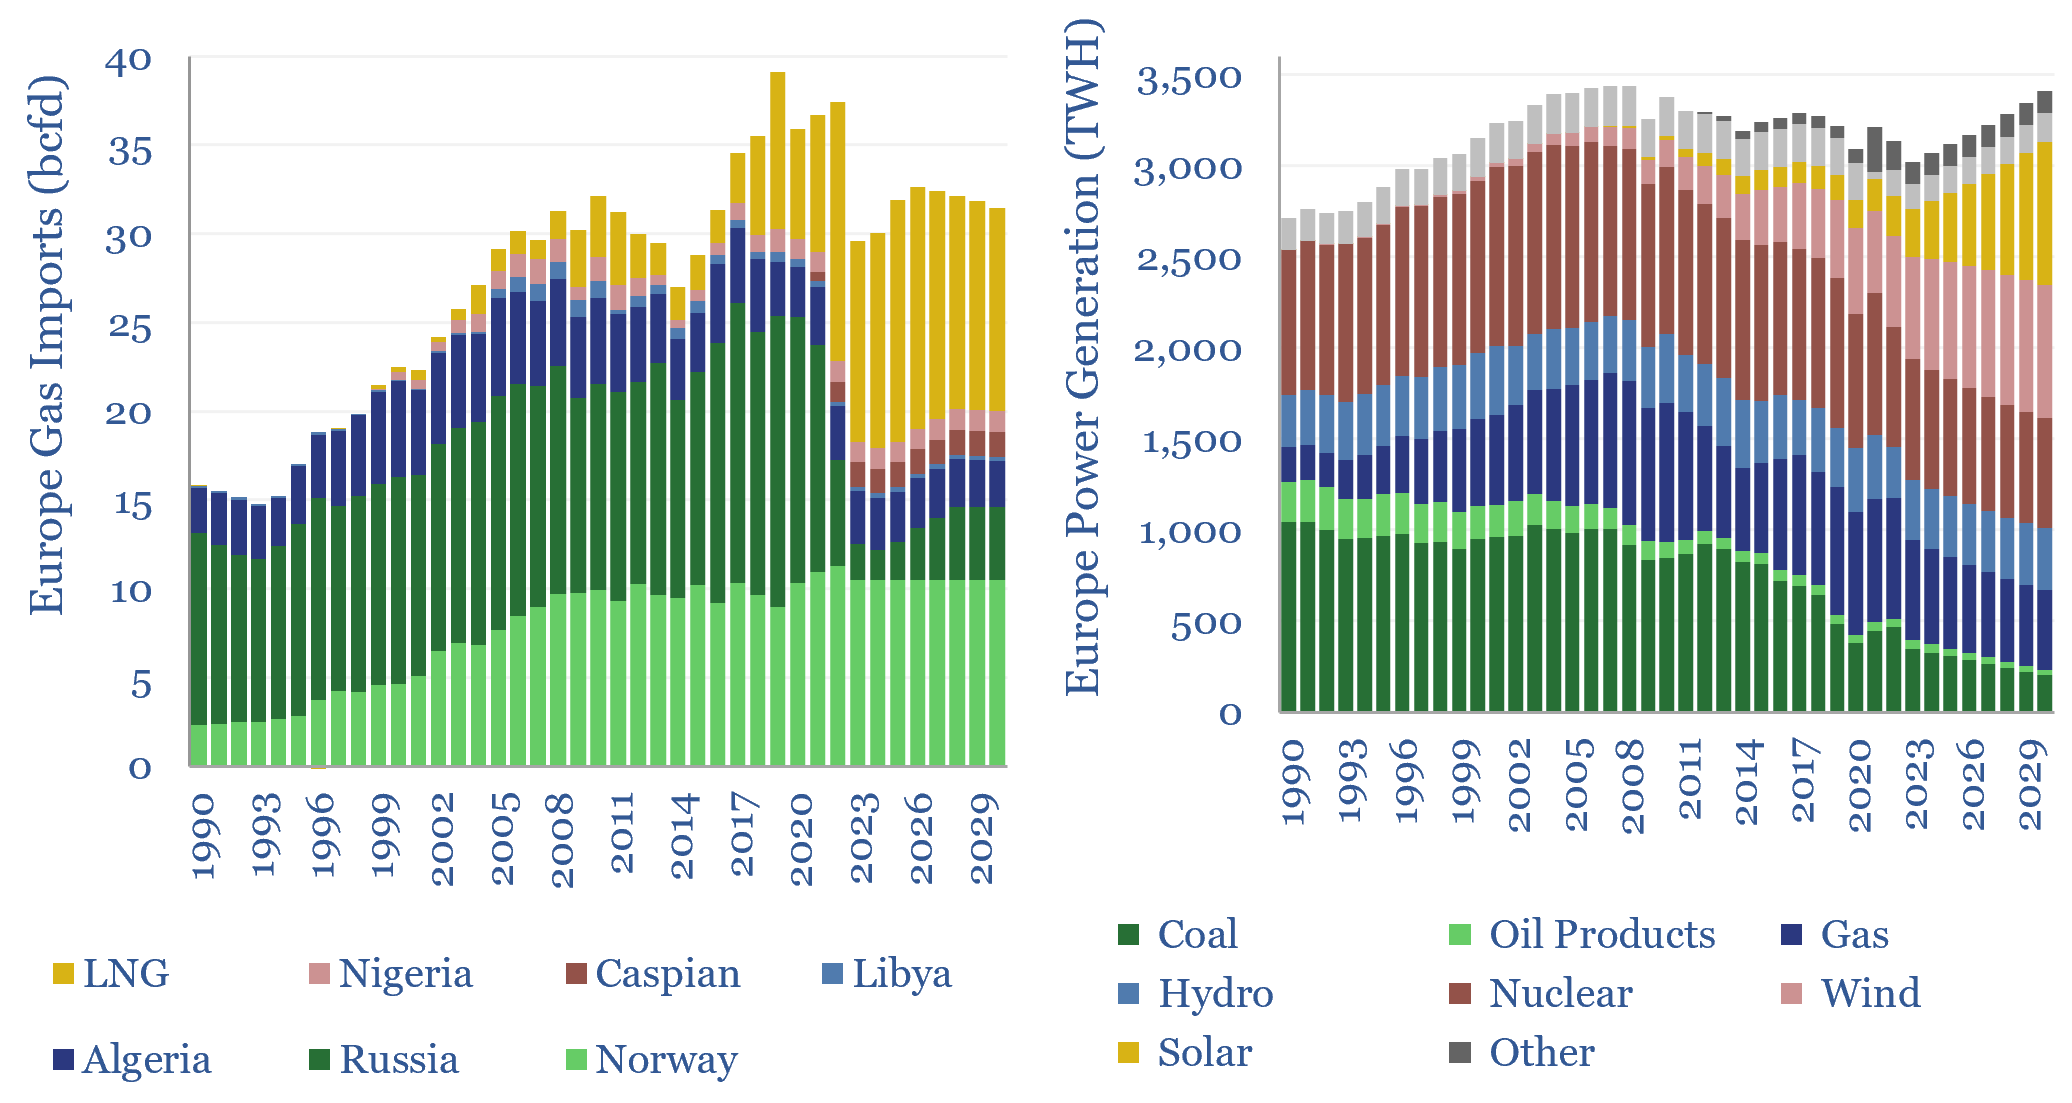
European gas and power markets will look better-supplied than they truly are in 2023-24. A dozen key input variables can be stress-tested in the data-file. Overall, we think Europe will need to source over 15bcfd of LNG through 2030, especially US LNG.
-
Gas power: levelized costs of combined cycle gas turbines?
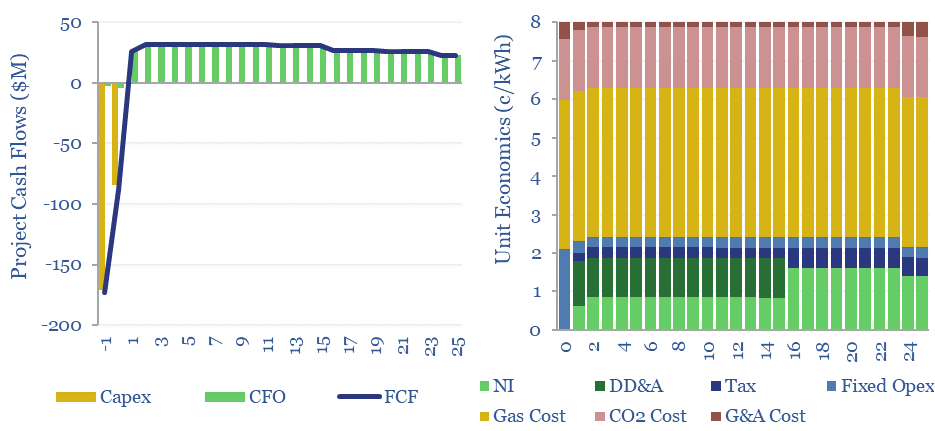
Levelized costs of combined cycle gas turbines are built up in this data-file. Our base case costs of gas-fired power generation are 8c/kWh, at a combined cycle turbine converting 55% of the thermal energy of natural gas into electrical energy, for a total CO2 intensity of 0.35 kg/kWh.
-
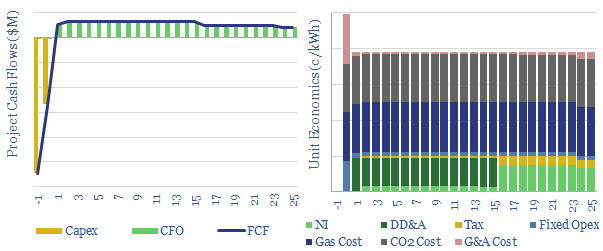
Fuel Cell Power Project Economics
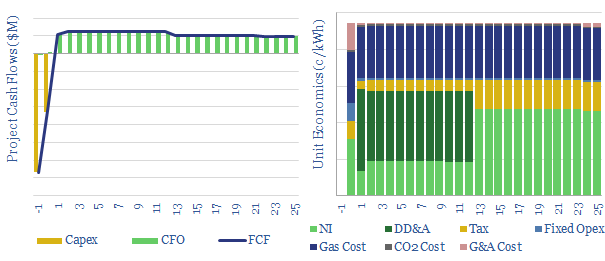
This data-file models the economics of constructing a new fuel-cell power project: generating electricity from grey, blue or green hydrogen. The model is based on technical papers and past projects around the industry. Economics look challenging. Our base case estimate is a 24c/kWh incentive price.
-
What oil price is best for energy transition?
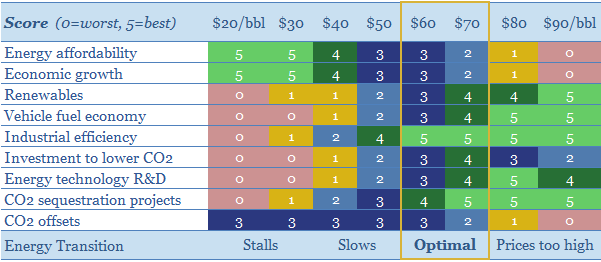
It is possible to decarbonize all of global energy by 2050. But $30/bbl oil prices would stall this energy transition, killing the relative economics of electric vehicles, renewables, industrial efficiency, flaring reductions, CO2 sequestration and new energy R&D. This 15-page note looks line by line through our models. We find stable, $60/bbl oil is ‘best’…
-
Decarbonize Heat?
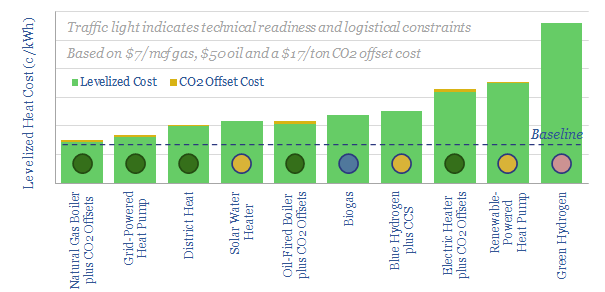
Natural gas fuels two-thirds of residential and commercial heating, which in turn comprises c10% of global CO2. We assessed ten technologies to decarbonize heat, including heat pumps, renewables, biogas and hydrogen. The lowest cost solution is to double down on natural gas with nature-based carbon offsets. Global gas demand for heating should continue rising.
-
Coal-to-Power Project Economics
Greenfield coal-to-power economics vary markedly by region. IRRs can reach 30% in emerging markets with low capex costs, high utilization and no carbon prices. But they fail to return their capital costs under developed world air standards and $25/ton CO2 pricing. Please download the model to stress-test the economics.
-
Coal-to-gas switching: what CO2 abatement cost?
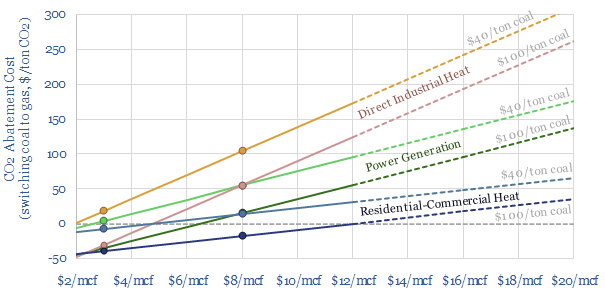
Coal-to-gas switching halves the CO2 emissions per unit of primary energy. This data-file estimates the CO2 abatement costs. Gas is often more expensive than coal. But as a rule of thumb, a $30-60/ton CO2 price makes $6-8/mcf gas competitive with $60-80/ton coal. CO2 abatement costs are materially lower in the US and after reflecting efficiency.…
-
Desalination by reverse osmosis: the economics?
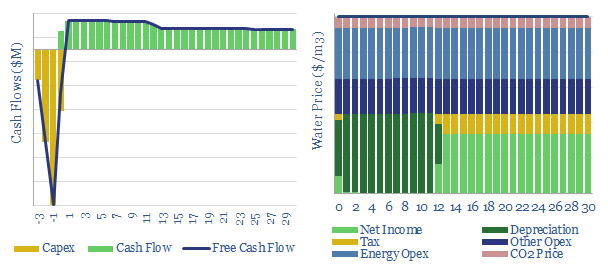
35bn tons of desalinated water are produced each year, absorbing 250 TWH of energy, or 0.4% of total global energy consumption. These numbers will likely rise, due to demographic trends, and due to climate change. Desalination costs average $1.0/m3, use 3.5kWh/m3 of electricity and can demand shift.
Content by Category
- Batteries (89)
- Biofuels (44)
- Carbon Intensity (49)
- CCS (63)
- CO2 Removals (9)
- Coal (38)
- Company Diligence (94)
- Data Models (838)
- Decarbonization (160)
- Demand (110)
- Digital (59)
- Downstream (44)
- Economic Model (204)
- Energy Efficiency (75)
- Hydrogen (63)
- Industry Data (279)
- LNG (48)
- Materials (82)
- Metals (80)
- Midstream (43)
- Natural Gas (148)
- Nature (76)
- Nuclear (23)
- Oil (164)
- Patents (38)
- Plastics (44)
- Power Grids (130)
- Renewables (149)
- Screen (117)
- Semiconductors (32)
- Shale (51)
- Solar (68)
- Supply-Demand (45)
- Vehicles (90)
- Wind (44)
- Written Research (354)