Search results for: “renewables”
-
Australia energy supply-demand model?
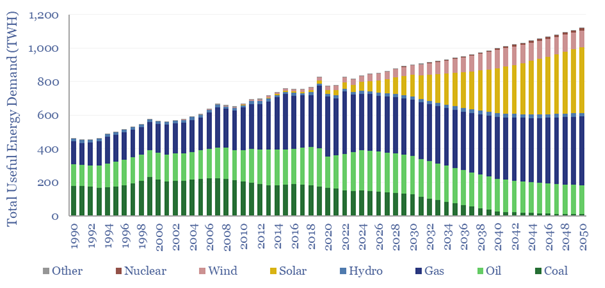
Australia’s useful energy consumption rises from 820TWH pa in 2023, by 1.2% pa 1,100 TWH pa in 2050. As a world-leader in renewables, it makes for an interesting case study. This Australia energy supply-demand model is disaggreated across 215 line items, broken down by source, by use, from 1990 to 2023, and with our forecasts…
-
Demand shifting: electrical flexibility by industry?
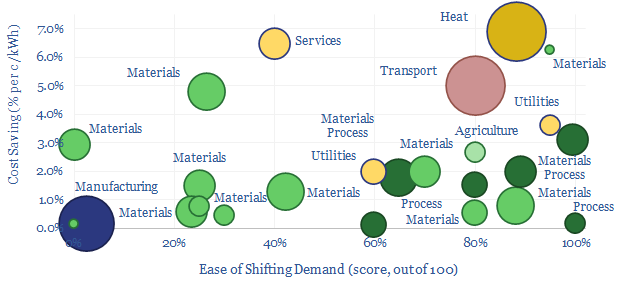
Demand shifting flexes electrical loads in a power grid, to smooth volatility and absorb more renewables. This database scores technical potential and economical potential of different electricity-consuming processes to shift demand, across materials, manufacturing, industrial heat, transportation, utilities, residential HVAC and commercial loads.
-
Reserve margins: by ISO and over time?
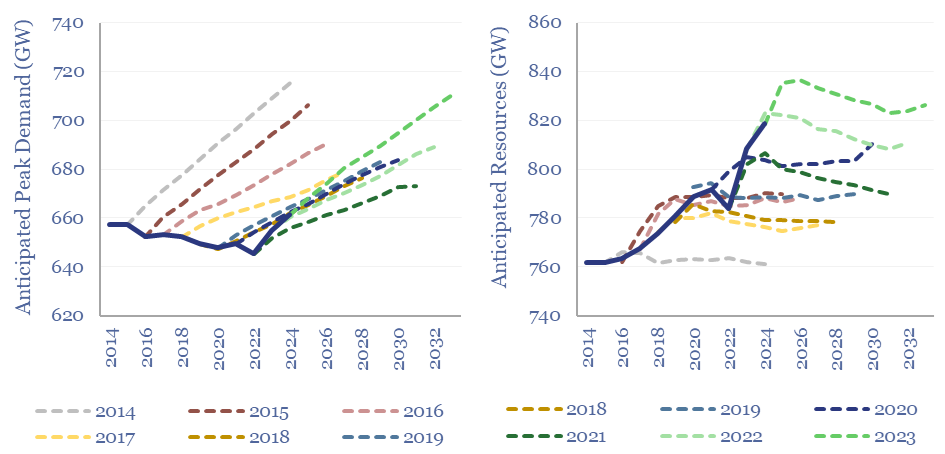
Reserve margins across major ISOs in the US power grid average 29% in 2024, are seen declining to 21% in the next decade by NERC, but could decline further, and below their recommended floors of at least 15%. Reasons include higher demand and controversies over the capacity contributions of renewables. This data-file tabulates reserve margin…
-
Power electronics: market size in energy transition?
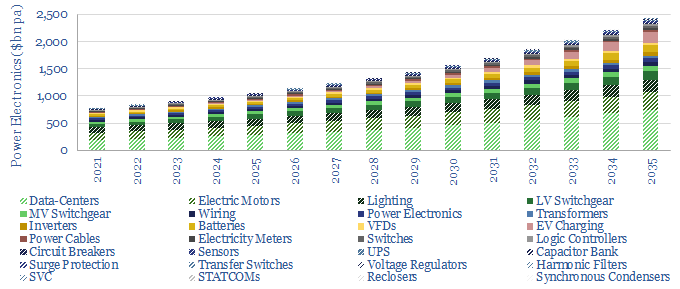
We describe c15 problems incurred by industrial and commercial power consumers. Many will require additional investment as renewables replace the large rotating generators of traditional power grids. Hence we see the market for commercial and industrial power electronics trebling from $360bn pa in 2021 to $1trn pa by 2035.
-
Power grids: global investment?
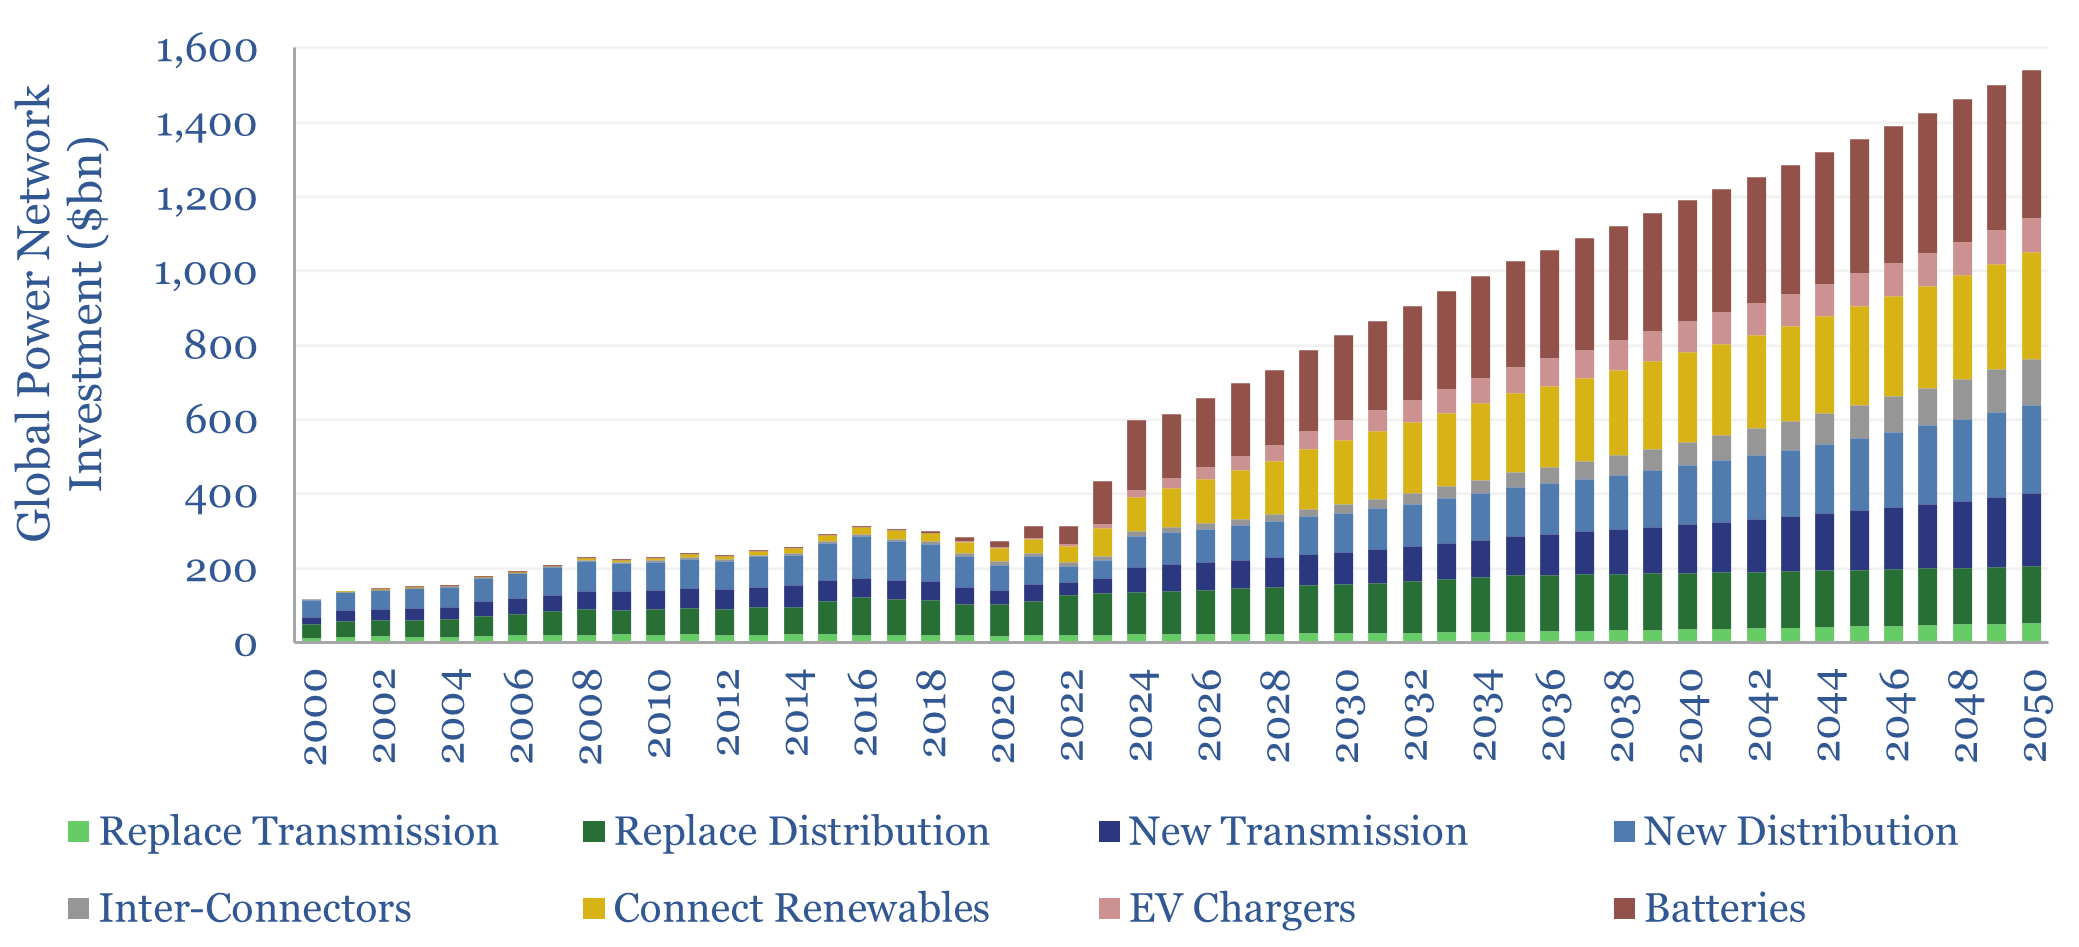
Global investment into power networks averaged $280bn per annum in 2015-20, of which two-thirds was for distribution and one-third was for transmission. Amazingly, these numbers step up to $600bn in 2030, >$1trn in the 2040s and can be as large as all primary energy investment.
-
Hydro power: generation by facility, availability over time?
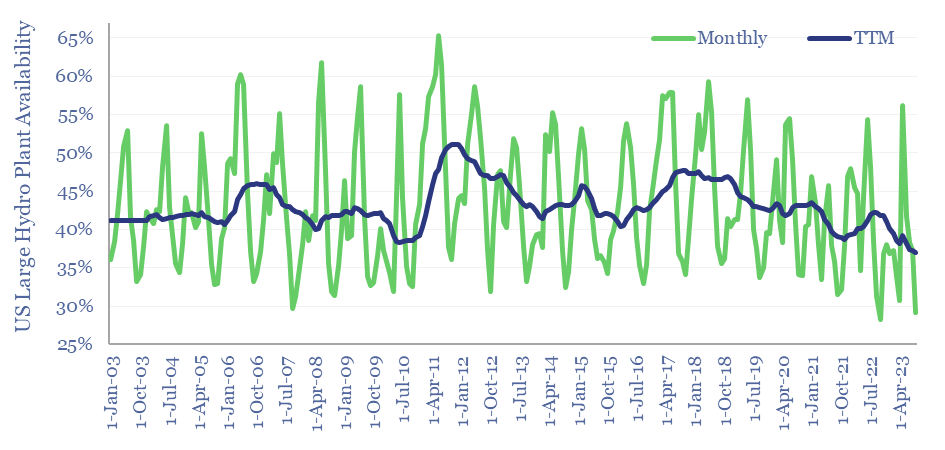
Hydro power generation by facility is tabulated in this data-file for the 20 largest hydro-electric plants in the US. The average facility achieves 43% availability, varying from 39% in hot-dry years to 51% in wet years; and from 33% at the seasonal trough in September-October to 53% at the seasonal peak in May-June. What implications…
-
Decarbonized power: how much wind and solar fit into the optimal grid?
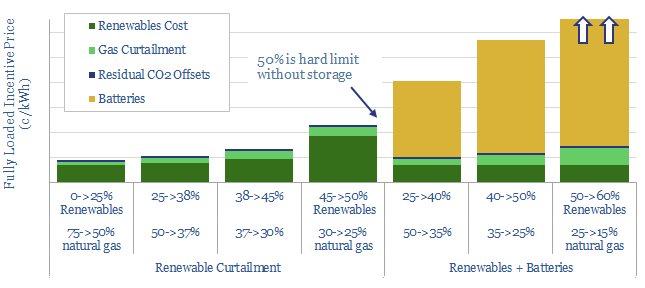
What should future power grids look like? Our answer optimizes costs, stability and CO2. Renewables do not surpass 45-50%. By this point, over 70% of new wind and solar will fail to dispatch, while incentive prices will have trebled. Batteries help little. They raise power prices by a further 2-5x to accommodate just 3-15% more…
-
Wind power: decline rates?
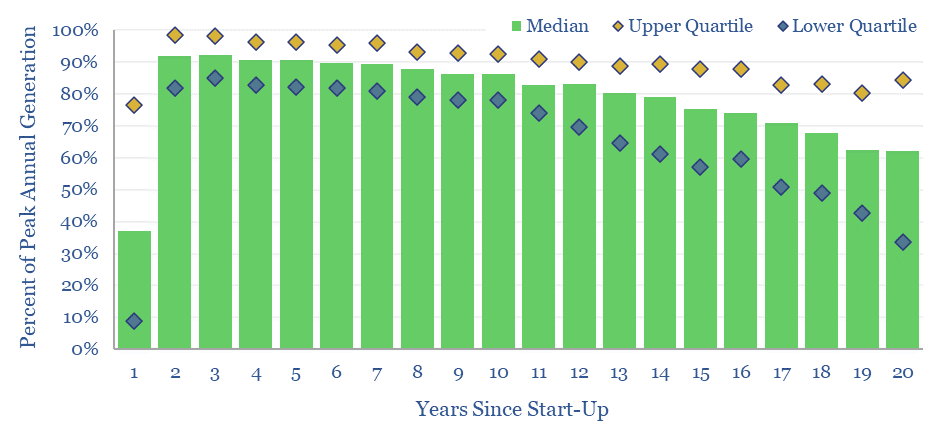
This data-file aggregates wind generation by facility, across the US, at 1,400 wind farms, going back 20-years. Wind power decline rates average 1% per year, then possibly accelerate to 3-4% per year in years 10-20. However wind generation is also noisy, typically varying +/- 7% YoY. This matters for the economics and ultimate share of…
-
Wind and solar: cost of grid interconnection?
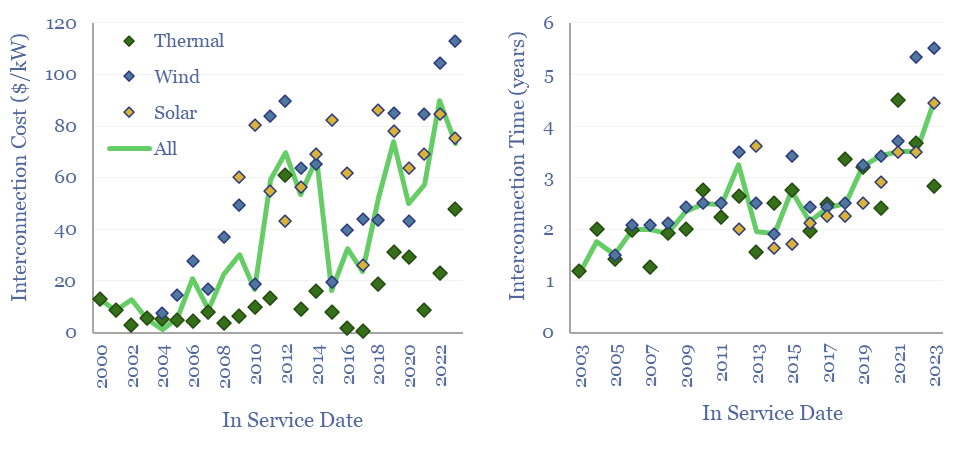
Cost of grid connection is shaping up to be a major bottleneck for the continued acceleration of new energies. A good baseline is to expect $100-300/kW of grid inter-connection costs, or $3-10/kW-km, over a typical distance of 10-70 km. But the requirement to fund network upgrade costs can push grid connections to cost more than…
-
Hydrogen: overview and conclusions?
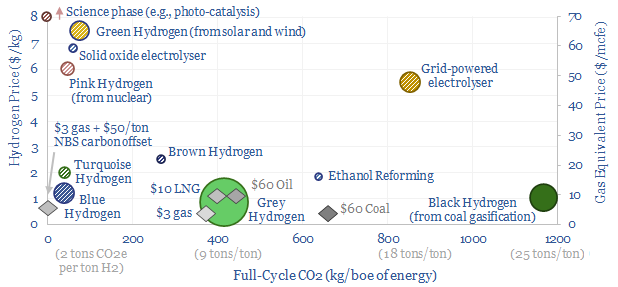
We think the best opportunities in hydrogen will be to decarbonize gas at source via blue and turquoise hydrogen, displacing ‘black hydrogen’ that currently comes from coal, and to produce small-scale feedstock on site via electrolysis for select industries. Others see green hydrogen as a cornerstone of the future energy system. We think there may…
Content by Category
- Batteries (89)
- Biofuels (44)
- Carbon Intensity (49)
- CCS (63)
- CO2 Removals (9)
- Coal (38)
- Company Diligence (95)
- Data Models (839)
- Decarbonization (160)
- Demand (110)
- Digital (60)
- Downstream (44)
- Economic Model (204)
- Energy Efficiency (75)
- Hydrogen (63)
- Industry Data (279)
- LNG (48)
- Materials (82)
- Metals (80)
- Midstream (43)
- Natural Gas (148)
- Nature (76)
- Nuclear (23)
- Oil (164)
- Patents (38)
- Plastics (44)
- Power Grids (130)
- Renewables (149)
- Screen (117)
- Semiconductors (32)
- Shale (51)
- Solar (68)
- Supply-Demand (45)
- Vehicles (90)
- Wind (44)
- Written Research (354)