Search results for: “renewables”
-
Renewable grids: solar, wind and grid-scale battery sizing?
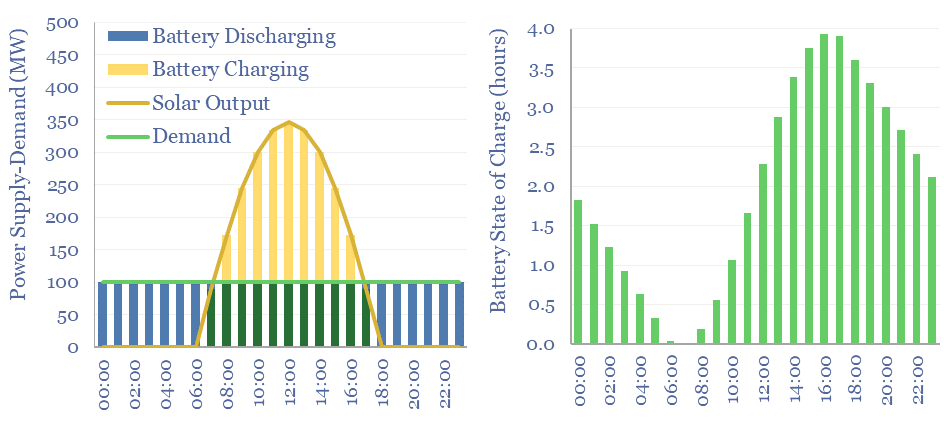
How much wind, solar and/or batteries are required to supply a stable power output, 24-hours per day, 7-days per week, or at even longer durations? This data-file stress-tests different scenarios, with each 1MW of average load requiring at least 3.5MW of solar and 3.5MW of lithium ion batteries, for a total system cost of at…
-
Pumped hydro: generation profile?
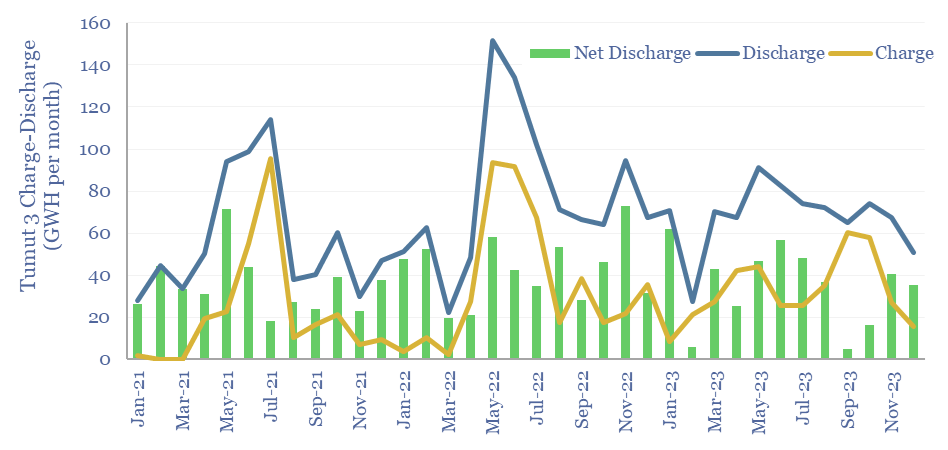
Pumped hydro facilities can provide long-duration storage, but the utilization rate is low, and thus the costs are high, according to today’s case study within the Snowy hydro complex in Australia. Tumut-3 can store energy for weeks-months, then generate 1.8 GW for 40+ hours, but it is only charging/dischaging at 12% of its nameplate capacity.
-
Overview of inertia in renewable-heavy grids?
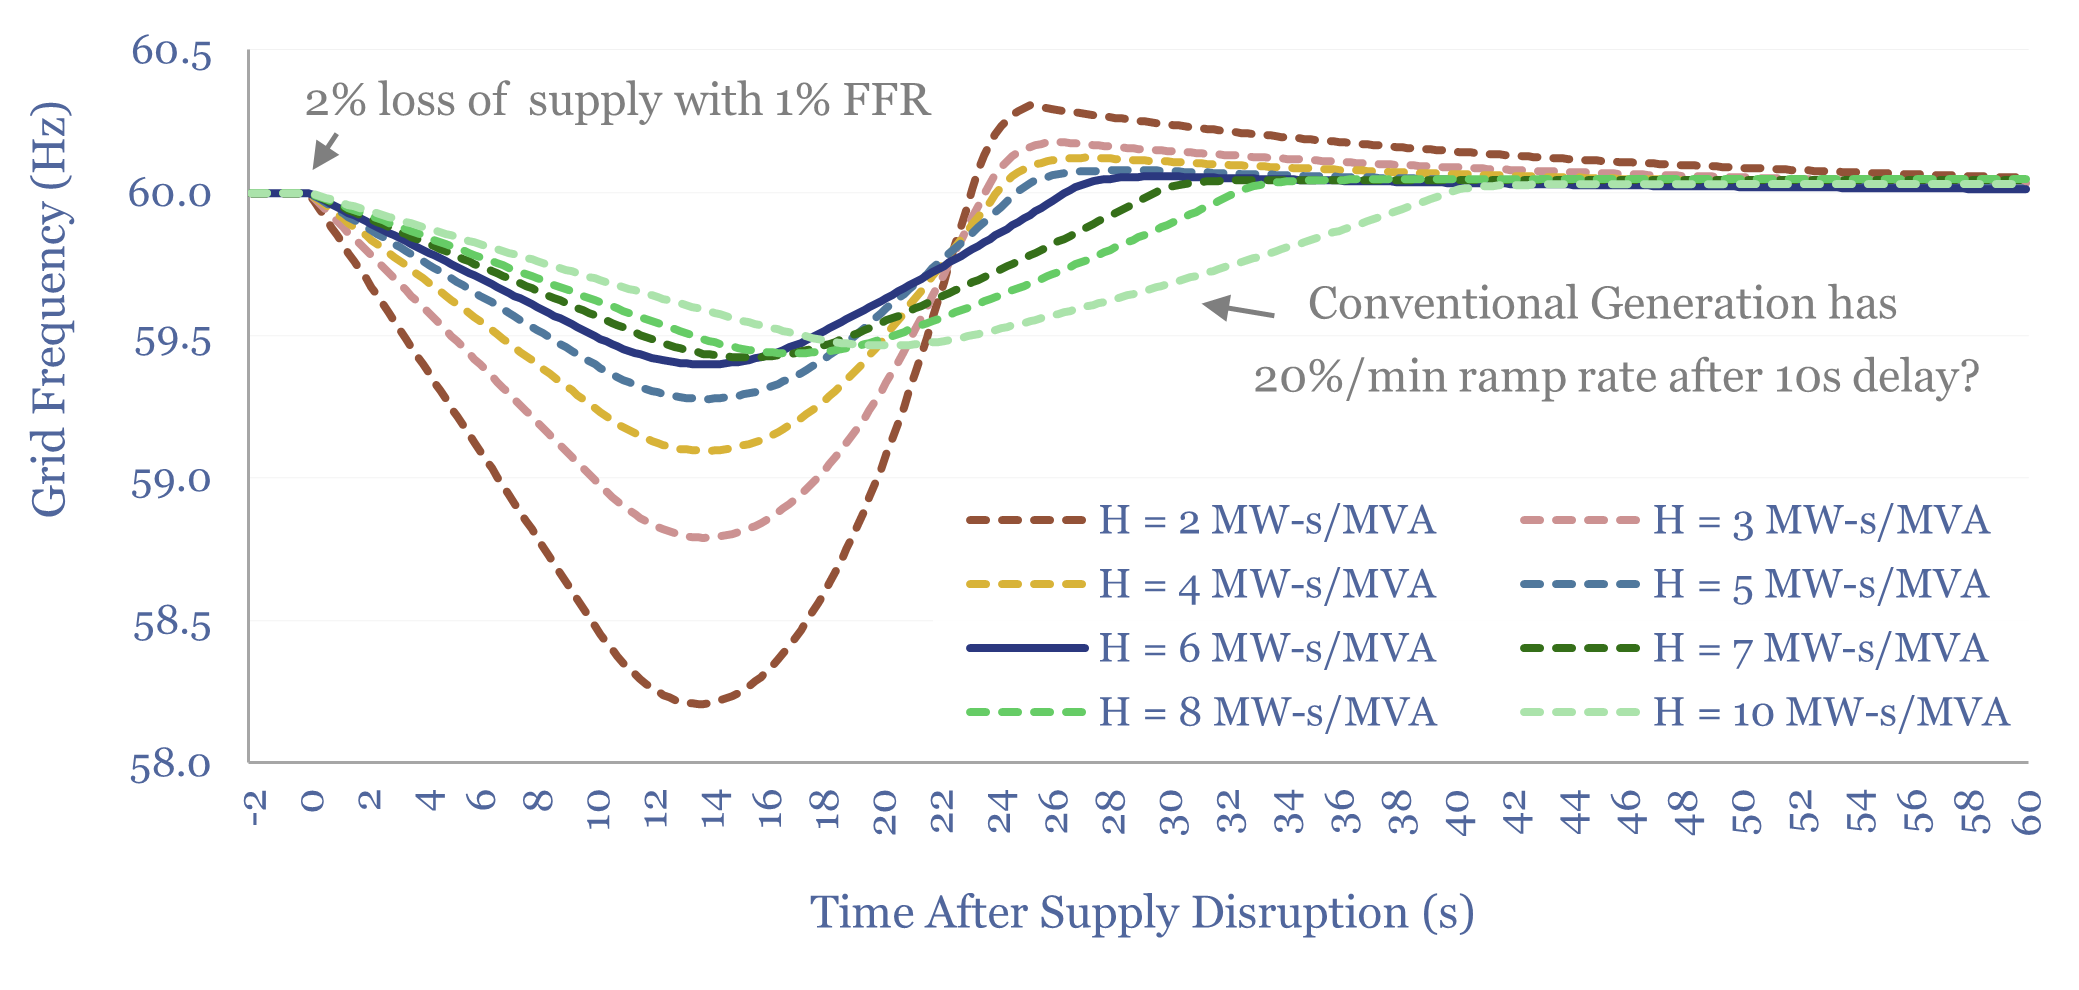
This overview of inertia in renewable-heavy grids tabulates the typical inertia of rotating generators, then models the resultant Rate of Change of Frequency (ROCOF) during supply disruptions. In our base case, a grid with 6 MW-s/MVA of inertia rides through a 2% supply-disruption, buffered by 1% fast frequency response (FFR), via lowering grid frequency from…
-
Global energy market model for the energy transition?
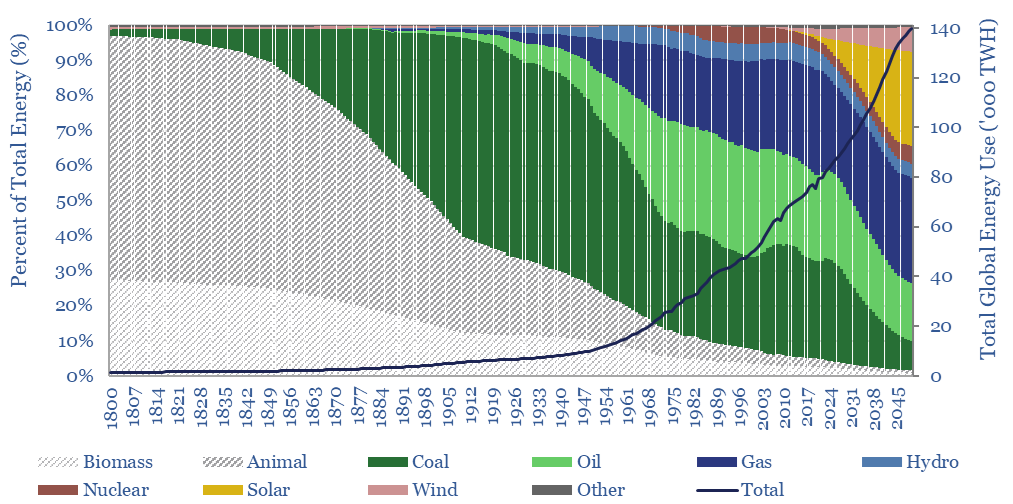
This data-file is a global energy market model for the energy transition. It contains long-term energy supply-demand forecasts by energy source; based on a dozen core input assumptions. Total useful energy consumed by human civilization rises from 80,000 TWH pa to 140,000 TWH pa by 2050. The mix is 30% gas, 30% solar, 15% oil,…
-
Portfolio Construction for Energy Majors?
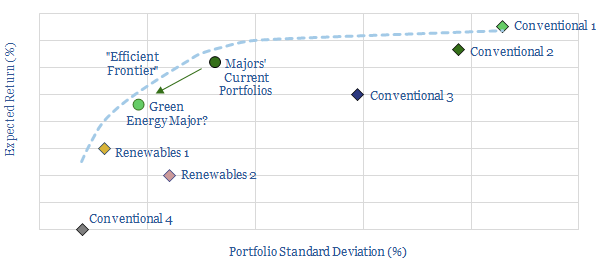
This data-model calculates risk-adjusted returns for different portfolio weightings in the energy sector, as companies diversify across upstream, downstream, chemicals, corporate; and increasingly, renewables and CCS. A set of optimal portfolio allocations are calculated, which maximise Sharpe ratios. You can also stress-test your own inputs.
-
Variable Power Tariffs Exacerbate Social Inequalities?
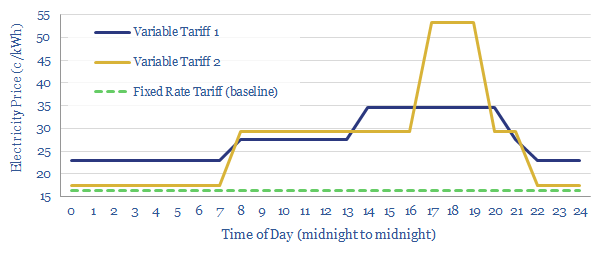
This data-file tabulates the impacts of variable electricity tariffs, after a large-scale US sample. Demand is inelastic, falling just 1% for a 20% price-increase. However, socially “vulnerable” consumers suffered disproportionately, with bills rising 4% more than non-vulnerable consumers.
-
Energy infrastructure: labor intensity?
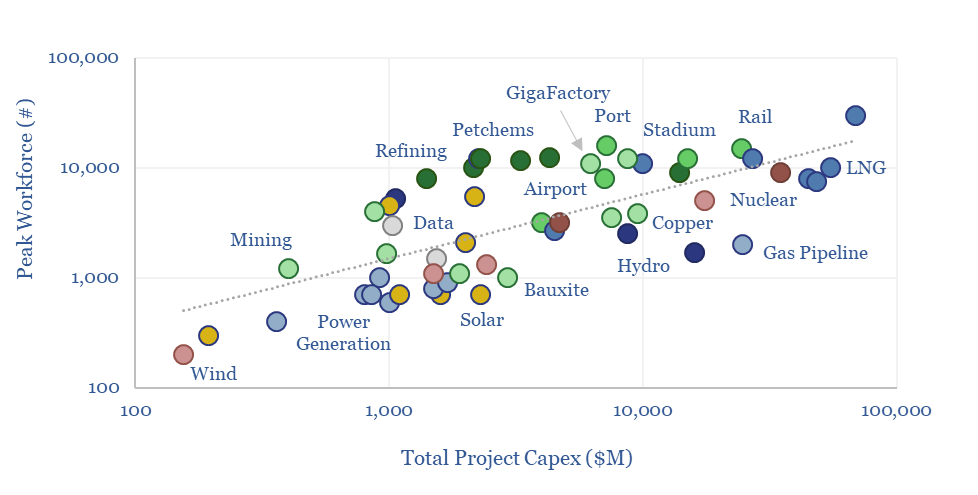
How many jobs are created by different types of energy? This data-file aggregates the labor intensity of different energy sources, which average 50-150 workers per TWH, on an ongoing basis. Another rough rule of thumb is that each $1bn of capex requires 1,000 peak constructon workers, although some project categories are materially more labor intensive…
-
Land intensity of energy transition: acres per MW and per ton?
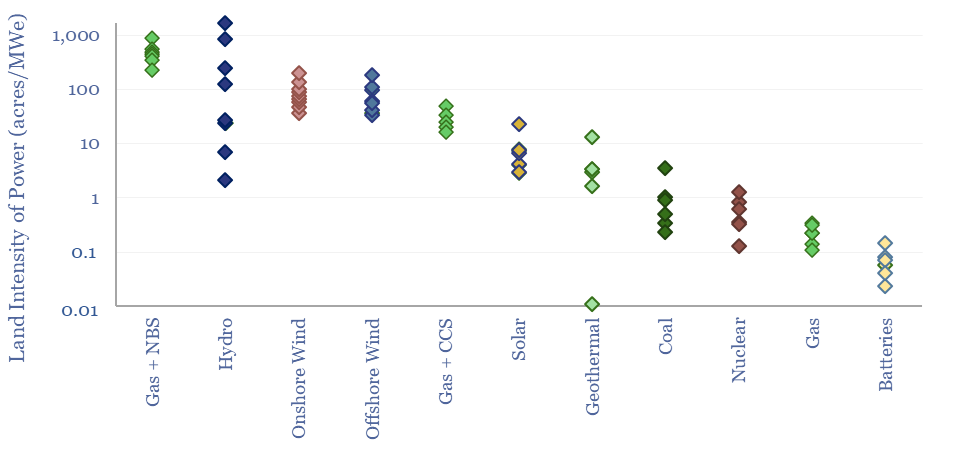
This data-file compares the land intensity of energy technologies and energy transition technologies. Land use is estimated in acres per MW of power generation, or in tons of CO2-equivalents abated per acre per year. Numbers vary by an order of magnitude. Data are sourced from technical papers and our broader work.
-
Vertical greenhouses: the economics?
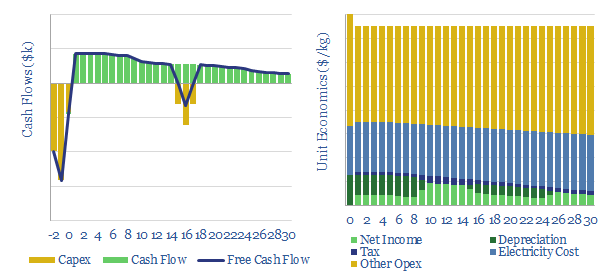
This data-file models the economics of vertical greenhouses, for growing greens, fruits and vegetables close to the consumer, in large multi-story facilities, lit by LED lighting. Our base case yields 10% IRRs off $1.25k/m2 capex and 50kg/m2/year yields. CO2 intensity depends heavily upon the CO2 intensity of the underlying grid.
-
Electric arc furnaces for lower-carbon steel production?
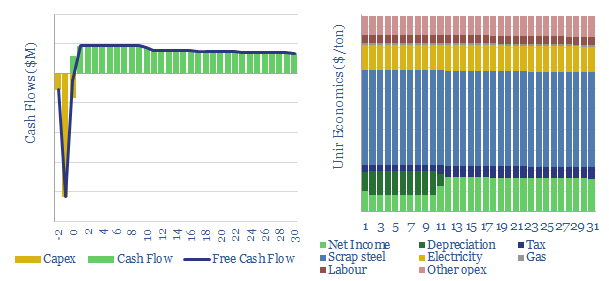
Electric arc furnaces generate enormous amounts of heat to recycle scrap steel, with 85% lower CO2 emissions than primary steel production. Our base case model yields a 15% IRR at $475/ton steel prices and a 10c/kWh power price. However, IRRs could be uplifted 2-6pp by integrating with renewables.
Content by Category
- Batteries (89)
- Biofuels (44)
- Carbon Intensity (49)
- CCS (63)
- CO2 Removals (9)
- Coal (38)
- Company Diligence (95)
- Data Models (840)
- Decarbonization (160)
- Demand (110)
- Digital (60)
- Downstream (44)
- Economic Model (205)
- Energy Efficiency (75)
- Hydrogen (63)
- Industry Data (279)
- LNG (48)
- Materials (82)
- Metals (80)
- Midstream (43)
- Natural Gas (149)
- Nature (76)
- Nuclear (23)
- Oil (164)
- Patents (38)
- Plastics (44)
- Power Grids (130)
- Renewables (149)
- Screen (117)
- Semiconductors (32)
- Shale (51)
- Solar (68)
- Supply-Demand (45)
- Vehicles (90)
- Wind (44)
- Written Research (354)