Search results for: “volatility volatile”
-
California’s grid: wind and solar statistical distributions?
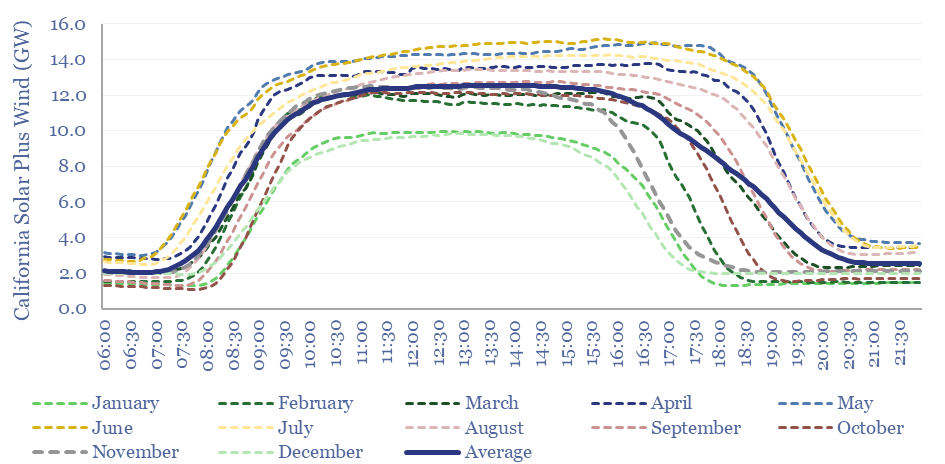
This data-file aggregates the statistical distribution of total electricity demand, solar generation and wind generation, every 5-minutes, across California, for the entirety of 2022, in order to understand their volatility and curtailment rates. The data suggest that wind and solar will most likely peak at 50-55% of renewables-heavy grids.
-
Global LNG supply model: by project and by country?

Global LNG output ran at 406MTpa in 2024. This model estimates global LNG production by facility across 150 LNG facilities. Our latest forecasts are that global LNG demand will rise at a 6% CAGR, to reach 710MTpa by 2035, for an absolute growth rate of +30MTpa per year, but there is a supply-crunch in 2024-26,…
-
Gas power generation across five-minute intervals?
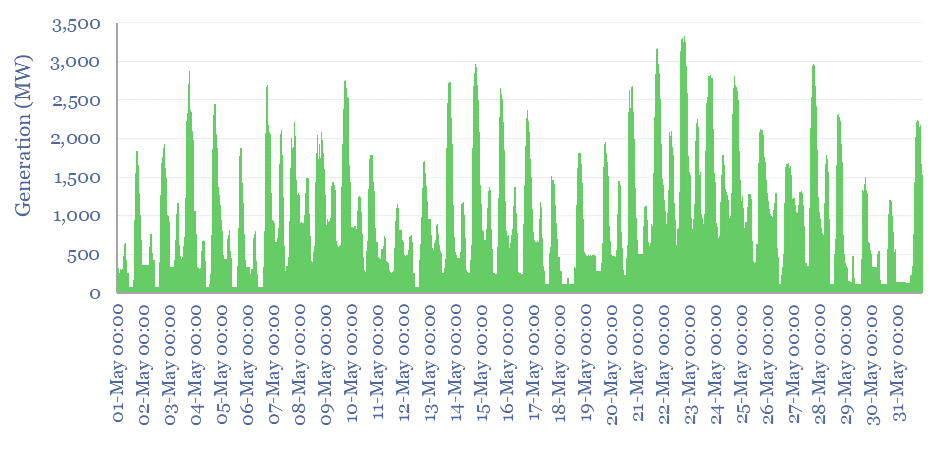
Power generation data are aggregated for ten of the largest CCGTs and gas peaker plants in Australia, across five-minute intervals, May-2024 and May-2014. This makes for a fascinating case study into how gas turbines are used to stabilize power grids, backstop renewables, and how this has changed over time.
-
Very long term historical commodity prices and disruptions?
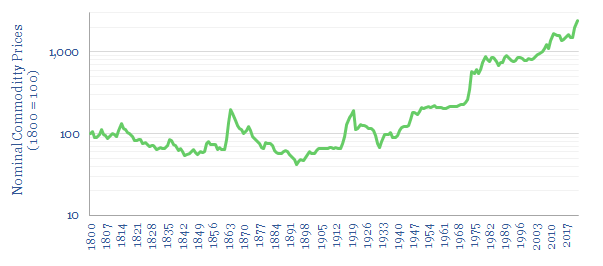
This data-file aggregates long-term historical commodity prices back to 1800, predominantly in the US, using academic records and census data. Historical commodity prices generally fell 30-70% in the 19th and early 20th century, punctuated by supply disruptions due to wars, then rose by 12.5x from 1945 to the present day.
-
Data-centers: electricity use and demand shifting?
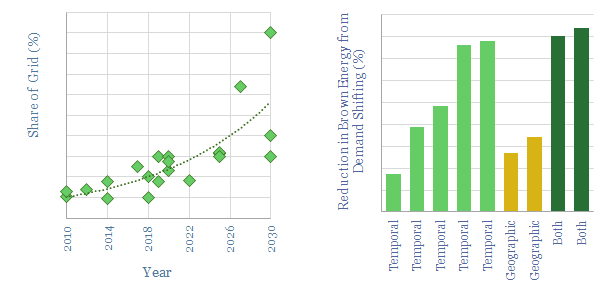
This data-file estimates data-centers’ electricity use and ability to demand shift. Large data centers how power demand in the range of 50-500MW. Around 40% of their electrical loads can demand shift, to help smooth out the volatility of renewables?
-
Inter-correlations between solar assets?
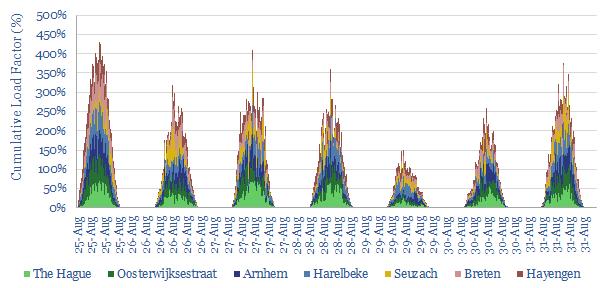
This data-file aggregates granular data from seven solar assets around Western Europe over a sample week. Absolute volatility is around 2-4% of nominal capacity every 15-minutes, while inter-correlations range from 60-90% depending on the distance between the different assets.
-
Global gas prices: by country?
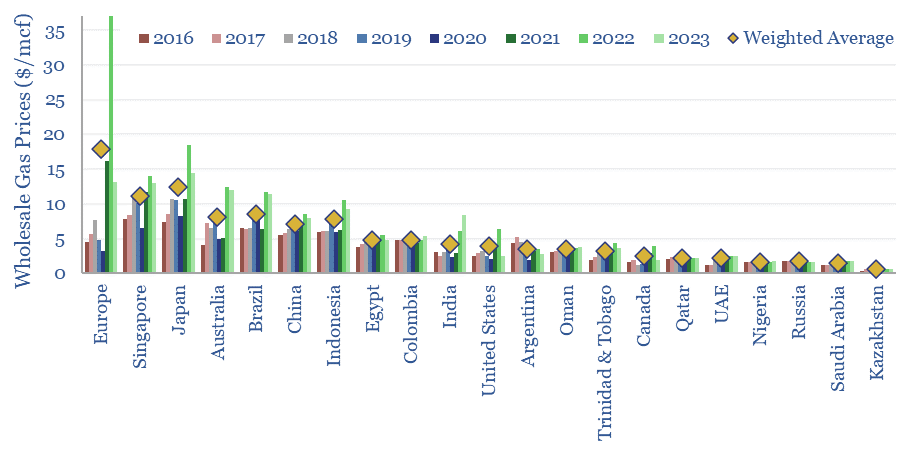
Global gas prices by country are often measured at the world-famous delivery points for liquids futures contracts, such as Henry Hub and the Netherlands’ TTF. This data-file takes a broader approach, aggregating the annual gas prices by country across twenty geographies.
-
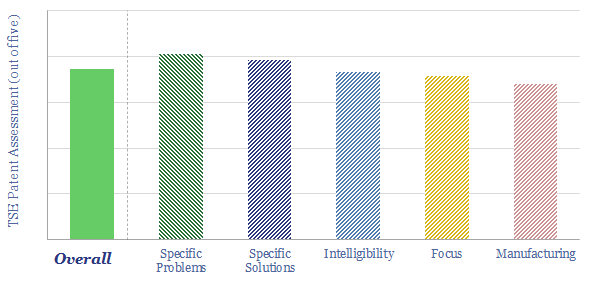
Powin: grid-scale battery breakthrough?
Powin commercializes energy storage hardware and software. Its LFP battery system is 30% more compact than peers, at 200 MWH/acre, and modular, meaning it may be 50% faster to install. Our patent review finds a moat around specific process improvements, to help back up the short-term volatility of solar and wind.
-
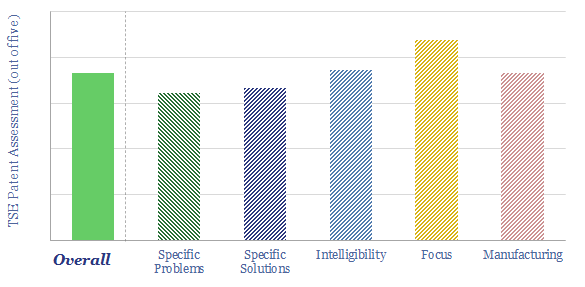
Sentient Energy: smart grid breakthrough?
This data-file is a technology review for Sentient Energy, assessing innovations in smart grids. Its technology can achieve energy savings via a combination of “Conservation Voltage Reduction” and “Volt-VAR optimization at the grid edge”. This also helps to integrate more solar and EV charging into power grids. We explain the technology.
-
Wind energy: beyond good and evil?
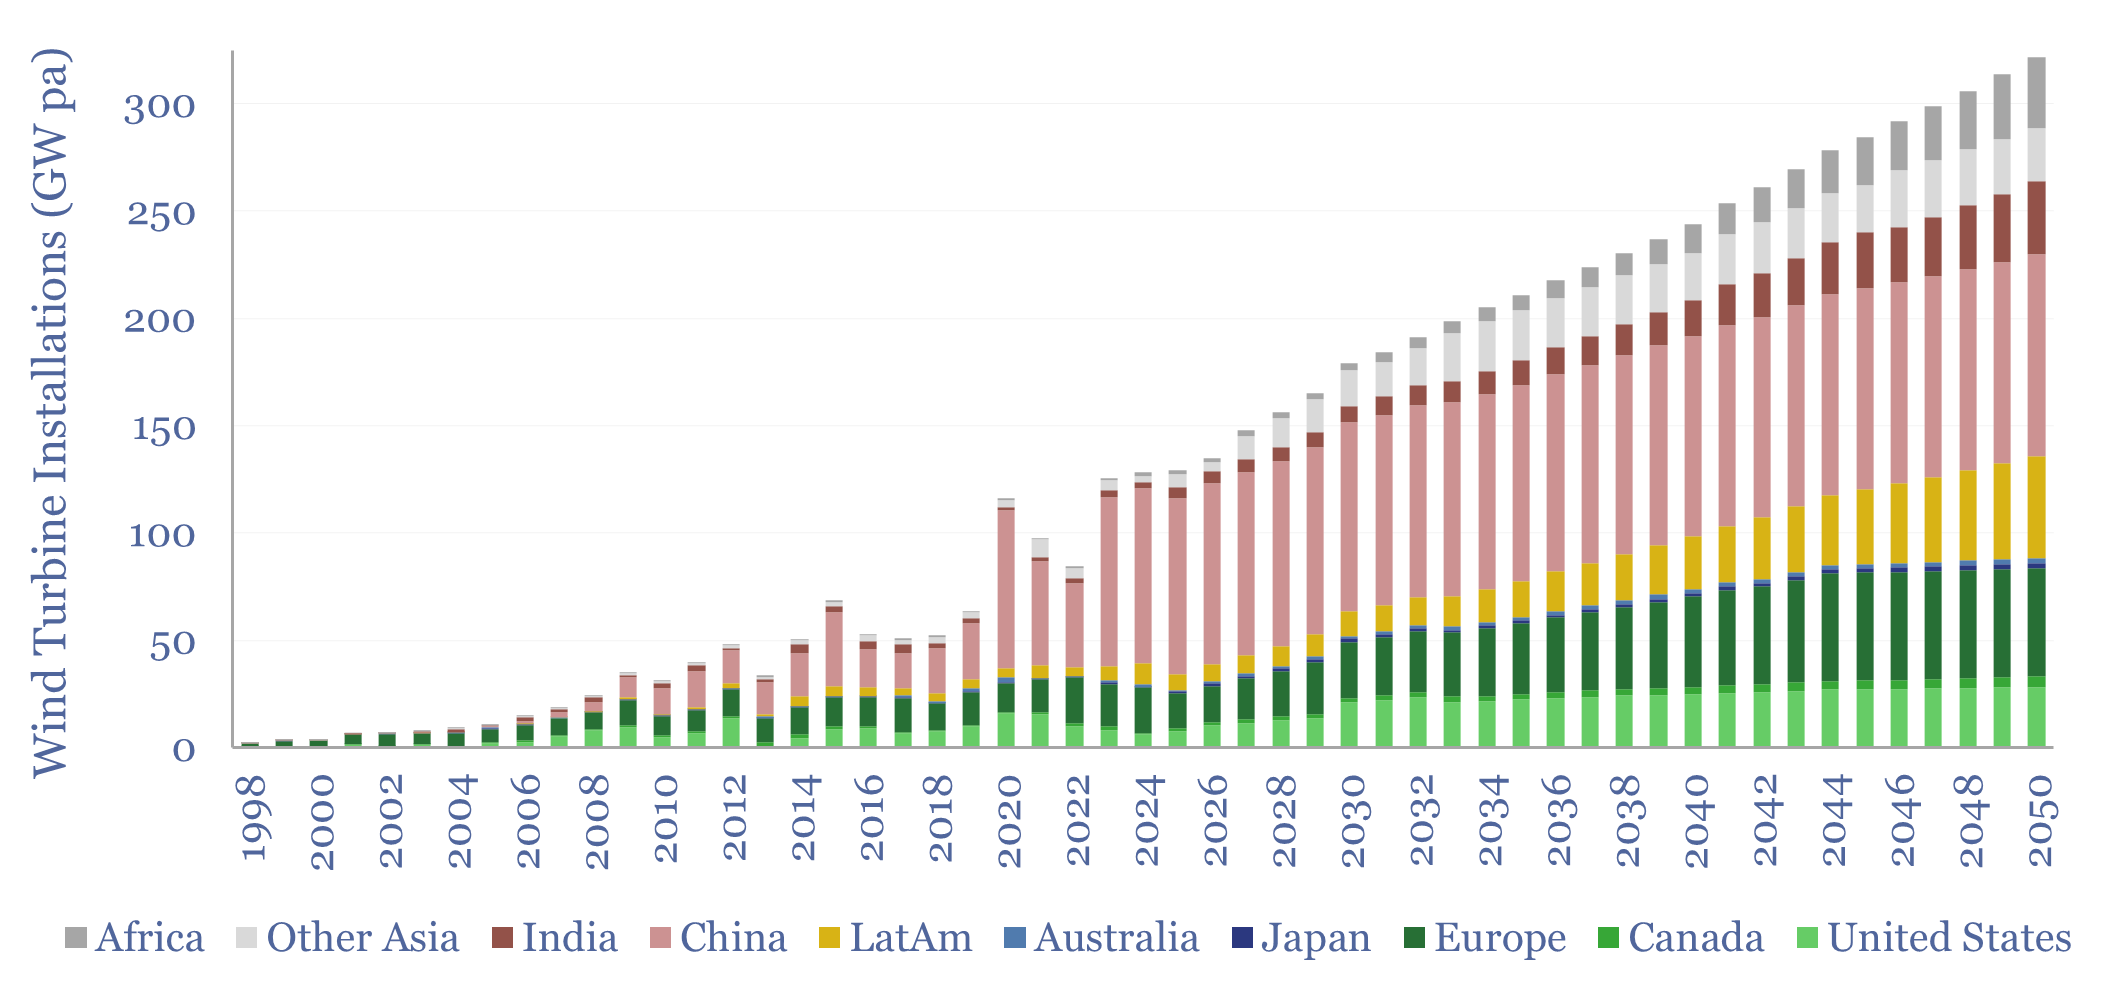
Wind economics are not good or bad in absolute terms. They depend on capacity factors, which average 26% globally, but can range from 10% to 60%. In the best locations, levelized costs are below 4c/kWh. Hence this 16-page note explores global wind capacity factors and updates our wind outlook by region throgh 2050.
Content by Category
- Batteries (89)
- Biofuels (44)
- Carbon Intensity (49)
- CCS (63)
- CO2 Removals (9)
- Coal (38)
- Company Diligence (95)
- Data Models (840)
- Decarbonization (160)
- Demand (110)
- Digital (60)
- Downstream (44)
- Economic Model (205)
- Energy Efficiency (75)
- Hydrogen (63)
- Industry Data (279)
- LNG (48)
- Materials (82)
- Metals (80)
- Midstream (43)
- Natural Gas (149)
- Nature (76)
- Nuclear (23)
- Oil (164)
- Patents (38)
- Plastics (44)
- Power Grids (131)
- Renewables (149)
- Screen (117)
- Semiconductors (32)
- Shale (51)
- Solar (68)
- Supply-Demand (45)
- Vehicles (90)
- Wind (44)
- Written Research (356)