Energy security: the return of long-term contracts?

Energy commodities

Spot markets have delivered more and more ‘commodities on demand’ over the past half-century. But is this model fit for the energy transition? Many markets are now desperately short, causing explosive price rises. And sufficient volumes may still not be available at any price. So this 13-page note on energy commodities considers a renaissance for long-term contracts and who might benefit?


Liquid spot markets have long been seen as the apotheosis of commodities. Over time, small and immature markets are supposed to graduate towards ever-greater liquidity. Ultimately, the entire market is to be bought and sold at the prevailing prices on some highly liquid exchange, where any seller in the market can reach any buyer in the market, and vice versa. It is a kind of “commodities on demand” model. The history and evolution of this model is laid out on pages 2-3. But 2022 is showing its limitations.

Challenge #1 for liquid spot markets is that prices can explode in a shortage. We review energy costs, price elasticity factors, and their consequences on pages 4-6.

Challenge #2 for liquid spot markets is that even after prices explode, sufficient supplies may still not be available at any price. We zoom in on LNG as an example on pages 7-8. A country that has 90% of its supplies locked in on contracts is clearly going to fare very differently in 2022-23 than one that had planned to source 90% of its supplies from the spot market.

Challenge #3 is securing future supplies amidst uncertainty. No one wants to finance a 20-year project where prices could collapse, volumes could collapse or the commodity in question could even be banned outright. As an OPEC oil minister recently stated “it isn’t going to work like that”.

Could all of this point to a renaissance for long-term contracts? On pages 11-13, we outline what this might look like, who might benefit, and some possible pushbacks.

For an outlook on our top 10 energy commodities with upside in the energy transition, please see our article here.

Global oil demand: rumors of my death?

Oil demand during COVID

‘Rumors of my death have been greatly exaggerated’. Mark Twain’s quote also applies to global oil consumption. This note aggregates demand data for 8 oil products and 120 countries over the COVID pandemic. We see 3.5Mbpd of pent-up demand ‘upside’, acting as a floor on medium-term oil prices.


We have compiled a database covering the entire global oil market, month by month, product by product, country by country, from 2017 through the end of 2021. We explain our database and some data quality issues on page 2.

The COVID pandemic is quantified in oil market terms on page 3. Global oil demand fell -22Mbpd at trough in April-2020, -9Mbpd YoY in 2020 as a whole. The declines were about 2x steeper in OECD countries versus non-OECD countries. Although global oil demand had returned above 2019 levels in Nov-Dec 21, there is still 3.5Mbpd of pent up demand.

Jet fuel is the biggest source. This is pretty clear from the charts on page 4.

Low income countries are the second largest source. Again, this is clear from the charts on page 5.

The gasoline market is bifurcating. OECD consumers have not fully resumed travelling, while EM demand is now 1Mbpd above 2019 levels, per page 6.

Another c20Mbpd of other oil products have shown inexorable increases throughout COVID-times, per page 7.

Our conclusions for oil demand during COVID are outlined on pages 8-9. Pent-up demand suggests oil prices must rise to whatever level prevents the demand from coming back.

A final post-script shows that Russia cannot win the war in Ukraine. The analogy from COVID is that OECD countries could displace all Russian exports from the market 1.5x over, if the political will was there for behavioral changes c65% as extreme as during COVID.

To see our calculations for the long-run oil demand to 2050, please see our article here.

Oil and War: ten conclusions from WWII?

Oil and war

The second world war was decided by oil. Each country’s war-time strategy was dictated by its availability, its quality and attempts to secure more of it; including by rationing non-critical uses of it. Ultimately, limiting the oil meant limiting the war. This would all re-shape the future of the oil, gas and midstream industries, and also the whole world. Today’s short essay about oil and war outlines out top ten conclusions from reviewing the history.

(1) War machines run on oil products

Fighter planes, bombers, tanks, battleships, submarines and supply trucks are all highly energy intensive. For example, a tank achieves a fuel economy of around 0.5 miles per gallon. Thus, Erwin Rommel wrote that “neither guns nor ammunition are of much use in modern warfare unless there is sufficient petrol to haul them around… a shortage of petrol is enough to make one weep”.

If the First World War was a war of stagnation, then the Second World War was one of motion. Overall, America’s forces in Europe would use 100x more gasoline in World War II than in World War I. Thus in 1944, General Patton berated Eisenhower that “my men can eat their belts, but my tanks have gotta have gas”.

The fuel for Germany’s war machine was imported from Romania’s Ploiesti fields (c30-40% of total use) and earlier in the War, from the Soviet Union (10-20%). Another achievement of ‘blitzkrieg’ warfare was that the German army initially captured more fuel than it used. Its remaining oil was produced in Germany, as synfuel (c50-60% of total).

Synfuel. Germany had always been an oil-poor, coal-rich nation, relying on the latter for 90% of its energy in the 1930s. But it could manufacture synthetic gasoline by hydrogenating the coal at high temperatures and pressures. The industrial methods were developed by IG Farben, with massive state subsidies (Hitler stated “the production cost [is] of no importance”). In 1936, Hitler re-doubled the subsidies, expecting to be at war by 1940, by which time, 14 hydrogenation plants were producing 72kbpd. By 1943, this was increased to 124kbpd. It was over half of Germany’s total war-time oil use and 90% of the aviation gasoline for the Luftwaffe.

On the other side, America provided 85% of the allies’ total oil. US output rose from 3.7Mbpd to 4.7Mbpd. 7bn bbls were consumed by the US and its allies from 1941-45, of which 6bn bbls was produced in the US.

(2) Securing oil dictated each country’s war strategy.

In 1939, Hitler and Stalin had carved up Europe via the Molotov-Ribbentrop pact, declaring mutual non-aggression against one another. But oil was a key reason that Hitler reneged, and went to war with the Soviet Union, in Operation Barbarossa, in June 1941. Stalin had already occupied Northern Rumania, which was too close for comfort to Ploiesti. Hitler would tell Mussolini that “the Life of the Axis depends on those oilfields”.

Moreover, Hitler wanted the oilfields of the Caucasus, at Maikop, Grozny and Baku. They were crucial. At the end of 1942, Hitler wrote “unless we get the Baku oil, the war is lost”. Even Rommel’s campaign in North Africa was the other arm of a large pincer movement, designed to converge on Baku.

Similarly for Japan, the entire Pacific War (and necessarily antecedent attack on Pearl Harbor), was aimed at capturing crucial oil fields of the Dutch East Indies, to which Japan would then commit 4,000 oilfield workers.

For the Allies, one of the most pressing needs was to ensure clear passage of American Oil across the Atlantic, without being sunk by German U-boats. Hence the massive step-up of cryptography at Bletchley Park under Alan Turing. In March-1943, the Allies broke the U-boat codes, allowing a counter-offensive. In May-1943 alone, 30% of the U-boats in the Atlantic were sunk. Increased arrivals of American oil would be a turning point in the war.

(3) Limiting the oil meant limiting the war.

Germany’s initial blitzkrieg warfare was particularly effective, as the Germans captured more fuel than they used. But they had less luck on their Eastwards offensives. Soviet tanks rank on diesel. Whereas the German Panzers ran on gasoline. And it became increasingly difficult to sustain long, Eastwards supply lines. Stalingrad became Germany’s first clear ‘defeat’ in Europe in 1942-43. 

Fuel shortages were also illustrated in North Africa, where Rommel later said his tactics were “decided more by the petrol gauge than by tactical requirements”. He wrote home to his wife about recurring nightmares of running out of fuel. To make his tank numbers look more intimidating, he even had ‘dummy tanks’ built at workshops in Tripoli, which were then mounted on more fuel-efficient Volkswagens.

Similarly in Japan, oil shortages limited military possibilities. ‘Kamikaze’ tactics were named after the ‘divine wind’, a typhoon which disrupted Kublai Khan’s 13th century invasion fleet. But they were motivated by fuel shortages: no return journey was necessary. And you could sink an American warship with 1-3 kamikaze planes, versus 8-24 bombers and fighters. It made sense if you had an excess of personnel and planes, and a shortage of fuel.

Similarly, in 1944, in the Marianas campaign’s “great turkey shoot”, Japan lost 273 planes and the US lost 29, which has been attributed to a lack of fuel, forcing the Japanese planes to fly directly at the enemy, rather than more tactically or evasively.

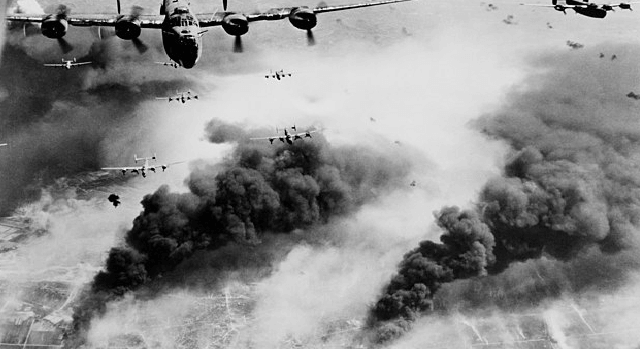
Remarkably, back in Europe, it took until May-1944, for Allied bombers to start knocking out Germany’s synthetic fuels industry, in specifically targeted bombing missions, including the largest such facility, run by IG Farben at Leuna. “It was on that day the technological war was decided”, according to Hitler’s Minister of War Production. In the same vein, this note’s title image above shows B-24s bombing the Ploiesti oilfields in May-1944.

By September-1944, Germany’s synthetic fuel output had fallen to 5kbpd. Air operations became impossible. In the final weeks of the War, there simply was no fuel. Hitler was still dictating war plans from his bunker, committing divisions long immobilized by their lack of fuel. In the final days of the War, German army trucks were seen being dragged by oxen.

Swiftly halting oil might even have prevented war. Japan had first attached Manchuria in 1931. As tensions escalated, in 1934, executives from Royal Dutch and Standard of New Jersey suggested that the mere hint of an oil embargo would moderate Japanese aggression, as Japan imported 93% of its oil needs, of which 80% was from the US. In 1937, an embargo was proposed again, when a Japanese air strike damaged four American ships in the Yangtze River. It was 1939 before the policy gained support, as US outrage grew over Japan’s civilian bombings in China. By then it was too late. In early 1941, Roosevelt admitted “If we stopped all oil [to Japan]… it would mean War in the Pacific”. On December 7th, 1941, a Japanese attack on Pearl Harbor forced the Americans’ hand.

(4) Fuel quality swayed the Battle of Britain?

The Messerschmitt 109s in the Luftwaffe were fueled by aviation gasoline derived from coal hydrogenation. This had an octane rating of 87. However, British Spitfires often had access to higher-grade fuel, 100-octane aviation gasoline, supplied by the United States. It was produced using catalytic cracking technology, pioneered in the 1930s, and deployed in vast, 15-story refinery units, at complex US refineries. The US ramped its production of 100-octane gasoline from 40kbpd in 1940 to 514kbpd in 1945. Some sources have suggested the 100-octane fuel enabled greater bursts of speed and greater maneuverability, which may have swung the balance in the Battle of Britain.

(5) The modern midstream industry was born.

Moving oil by tankers turned out to be a terrible war-time strategy. In 1942, the US lost one-quarter of all its oil tanker tonnage, as German U-boats sunk 4x more oil tankers than were built. This was not just on trans-Atlantic shipments, but on domestic routes from the Gulf Coast, round Florida, and up the East Coast. Likewise, by 1944-45, Japan was fairly certain that any tanker from the East Indies would be sunk shortly after leaving port.

The first truly inter-continental pipelines were the result. In 1943, ‘Big Inch’ was brought into service, a 1,254-mile x 24” line carrying oil from East Texas, via Illinois, to New Jersey. In 1944, ‘Little Inch’ started up, carrying gasoline and oil products along the same route, but starting even further south, at the US Gulf Coast refining hub, between Texas and Louisiana. The share of East Coast oil arriving by pipeline increased from 4% in 1942 to 40% by the end of 1944.

The first subsea pipeline was also deployed in the second world war, known as PLUTO (the Pipeline Under the Ocean). It ran under the English channel and was intended to supply half of the fuel needs for the Allies to re-take Europe. One of the pumping stations, on the Isle of Wight, was disguised as an ice cream shop, to protect it from German bombers. However, PLUTO was beset by technical issues, and only flowed 150bpd in 1944, around 0.15% of the Allied Forces’ needs.

Other mid-downstream innovations were small portable pipeline systems, invented by Shell, to transport fuel to the front without using trucks; and the five gallon ‘jerry can’. The Allies initially used 10-gallon portable fuel cannisters, but they were too heavy for a single man to wield. The smaller German convention was adopted. And improved, with a spout that prevented dirt from being transferred into vehicle engines.

(6) The modern gas industry was also born.

As the US tried to free up oil supplies from its residential heating sector, Roosevelt wrote to Harold Ickes, his Secretary of the Interior, in 1942, “I wish you would get some of your people to look into the possibility of using natural gas… I am told there are a number of fields in the West and the Southwest where practically no oil has been discovered, but where an enormous amount of natural gas is lying idle in the ground because it is too far to pipe”.

(7) Rationing fuel became necessary everywhere.

In the UK, war-time rationing began almost immediately, with a ‘basic ration’ set at 1,800 miles per year. As supplies dwindled, so did the ration, eventually towards nil. The result was a frenzy of war-time bicycling.

In Japan, there was no domestic oil use at all. Even household supplies of spirits or vegetable oils were commandeered to turn into fuel. Bizarrely, millions were sent to dig up pine roots, deforesting entire hillsides, in the hope that they could be pyrolyzed into an fuel-substitute.

Curtailing US demand was slower. In 1941, Ickes did start implementing measures to lower demand. He recommended a return to the ‘Gasoline-less Sundays’ policy of WWI and ultimately pressed oil companies to cut service station deliveries by 10-15%. Homeowners who heated their houses with oil were politely asked to keep their temperatures below 65ºF in the day, 55ºF at night.

Outright US rationing occurred later, starting in early-1942. First gasoline use was banned for auto-racing. Then general rationing of gasoline started on the East Coast. Even later, nationwide rationing was brought in at 1.5-4 gallons per week, alongside a 35mph speed limit and an outright ban on “non-essential driving” in 1943.

General US oil rationing provoked outrage. Interestingly, it was motivated just as much by rubber shortages as oil shortages. Japan’s capture of the East Indies had cut off 90% of the US’s rubber imports, and what little rubber was available, was largely needed for military vehicles. Ultimately, the consumption of fuel per passenger vehicle was 30% less in 1943 than in 1941.

(8) War-time measures tested civilian resolve.

In WWII, ambivalence was most clearly seen in the US, where support for the War was initially marginal, and conflicted with domestic economic interests.

The State of New Jersey denounced fuel rationing, lest it hamper tourism at its summer resorts. Likewise, in Miami, the tourism industry rebuffed a campaign to turn off 6-miles of beach-front neon lights, which were literally lighting up the coastal waters, so German U-boats could easily pick off the oil tankers.

In direct opposition to war-time interests, some US gasoline stations openly declared they would make as much fuel available to motorists as required, advertising that motorists should come “fill it up”. There will always be a few idiots who go joy-riding during a crisis.

(9) The map of the modern World

The entire future of the 20th century would also be partly decided by ‘who got there first’ in the liberation of Nazi Europe. Thus, Russia’s sphere of influence, was decided in particular by oil supplies in the final months of the War.

The Allies’ path to Berlin in 1944-45 was 8-months slower than it should have been, hampered by logistical challenges of fueling three separate forces, on their path to the heart of Europe. General Patton wrote home in 1944 that “my chief difficulty is not the Germans, but gasoline”.

The lost time was important. It is what allowed the Soviet Union to capture as much ground as it did, including reaching Berlin before the Western Allies. This would help decide the fate of Republics such as East Germany, Poland, Czechoslovakia, Hungary and Yugoslavia. All ended up being ‘liberated’ by the Soviets. This sealed their fate, ending up as part of the greater Soviet Empire.

Further East, oil-short Japan also approached the Soviet Union as a potential seller of crude. However, Churchill and Roosevelt made Stalin a better offer. The return of territories that Czarist Russia had lost to Japan in the humiliating War of 1905, such as Northern Manchuria and the Sakhalin Islands. The latter, ironically, now produces 300kbpd of oil and 12MTpa of LNG.

(10) Scorched Earth after capture (but NOT BEFORE)

Scorched Earth is a phrase that now conjures images of giant plumes of smoke, rising into the air from 600 large Kuwaiti oil wells, as Iraqi forces retreated during the 1990-91 Gulf War.

However, scorched earth policies were implemented everywhere in the Second World War. The Soviets absolutely destroyed Maikop before it was captured, so the Germans could only produce 70bpd there by the following year.

In 1940-42, in the Dutch East Indies, a Shell team was drafted in to obliterate the oil fields and refinery complex at Balikpapan before it could fall into Japanese hands, with fifteen sticks of TNT affixed to each tank in the tank farm. It burned for days.

Back at Shell-Mex House, the British also drew up plans to destroy their fuel stocks if invaded. Most incredibly, at the Start of World War II, France even offered Rumania $60M to destroy its oilfields and deprive their Prize to the Germans.

Strangely, some policymakers and investors appear to have had something of a ‘scorched earth’ policy towards the West’s oil and gas industry in recent years. As war re-erupts in the Western world, the history may be a reminder of the strategic need for a well-functioning energy industry. Energy availability has a historical habit of determining the course of wars.  

End note. The world’s best history book has provided the majority of anecdotes and data-points for this article. Source: Yergin, D.(1990). The Prize: The Epic Quest for Oil, Money & Power. Simon & Schuster. London. I cannot recommend this book highly enough. The cover image is from Wikimedia Commons.

Decarbonizing global energy: the route to net zero?

Decarbonizing global energy

This 18-page report revises our roadmap for the world to reach ‘net zero’ by 2050. The average cost is still $40/ton of CO2, with an upper bound of $120/ton, but this masks material mix-shifts. New opportunities are largest in efficiency gains, under-supplied commodities, power-electronics, conventional CCUS and nature-based CO2 removals.

Important note: our latest roadmap to net zero is from 2022, published here. But this note remains on our website, for transparency into our views at the end of 2021.


This note looks back across 750 of our research publications from 2019-21 and updates our most practical, lowest cost roadmap for the world to reach ‘net zero’. Our framework for decarbonizing 80GTpa of potential emissions in 2050 is outlined on pages 2-3.

Our updated roadmap is presented on pages 4-6. Most striking is the mix-shift. New technologies have been added at the bottom of the cost curve. Other crucial components have re-inflated. And we have also been able to tighten the ‘risking factors’ on earlier-stage technologies, thus an amazing 87% of our roadmap is not technically ready.

The resulting energy mix and costs for the global economy are spelled out on pages 7-8, including changes to our long-term forecasts for oil, gas, renewables and nuclear.

What has changed from our 2020 roadmap? A full attribution is given on pages 9-10. Disappointingly, global emissions will be 2GTpa higher than we had hoped mid-decade, as gas shortages perpetuate the use of coal.

A more detailed review of our roadmap is presented on pages 11-18. We focus on summarizing the key changes in our outlook in 2021, in a simple 1-2 page format: looking across renewables, nuclear, gas shortages, inflationary feedback loops, more efficiency gains, carbon capture and storage and nature-based carbon removals.

Is the world investing enough in energy?

Global energy investment in 2020-21

Global energy investment in 2020-21 has been running 10% below the level needed on our roadmap to net zero. Under-investment is steepest for solar, wind and gas. Under-appreciated is that each $1 dis-invested from fossil fuels must be replaced with $25 in renewables, to add the same new energy supplies. Future energy capex requirements are staggering. These are the conclusion in our 14-page note.


This 14-page note compares annual energy investment in different upstream energy sources with the amounts that would be required on our roadmap to net zero. The methodology is explained on page 2.

Current investment levels in each energy source are described on pages 3-5, reviewing the trajectory for each major category: oil, gas, coal, wind and solar. A stark contrast is found in capex per MWH of new added energy supplies.

We have constructed 120 different models, in order to stress-test the capex costs per MWH of new added energy supplies, across different resource types. Conclusions and comparisons from our modelling are presented on pages 6-8.

How much would the world need to be investing, on our roadmap to net zero, or indeed on the IEA’s roadmap to net zero? We develop our numbers, category by category, on pages 9-12, to identify where the gaps are greatest.

Conclusions and controversies are laid out on pages 13-14. Disinvestment from oil and gas will tend to exacerbate future energy shortages. To avoid this, it would be ideal to replace each dis-invested $1 of oil and gas investment with around $25 of new renewables investment.

CO2-EOR: well disposed?

CO2-EOR economics to decarbonize oil

CO2-EOR is the most attractive option for large-scale CO2 disposal. Unlike CCS, which costs over $70/ton, additional oil revenues can cover the costs of sequestration. And the resultant oil is 50% lower carbon than usual, on a par with many biofuels; or in the best cases, carbon-neutral. The technology is fully mature and the ultimate potential exceeds 2GTpa. This 23-page report outlines the opportunity.


The rationale for CO2-EOR is to cover the costs of CO2 disposal by producing incremental oil. Whereas CCS is pure cost. These costs are broken down and discussed on pages 2-5.

An overview of the CO2-EOR industry to-date is presented on pages 6-7, drawing on data-points from technical papers.

Our economic model for CO2-EOR is outlined on pages 8-10, including a full breakdown of capex, opex, and sensitivities to oil prices and CO2 prices. Economics are generally attractive, but will vary case-by-case.

What carbon intensity for CO2-EOR oil? We answer this question on pages 11-12, including a debate on the carbon-accounting and a contrast with 20 other fuels.

The ultimate market size for CO2-EOR exceeds 2GTpa, of which half is in the United States. These numbers are outlined on pages 13-15.

Technical risks are low, as c170 past CO2-EOR projects have already taken place around the industry, but it is still important to track CO2 migration through mature reservoirs and guard against CO2 leakages, as discussed on pages 16-17.

How to source CO2? We find large scale and concentrated exhaust streams are important for economics, as quantified on pages 18-21.

Which companies are exposed to CO2-EOR? We profile two industry leaders on page 22.

What implications for reaching net zero? We have doubled our assessment of CO2-EOR’s potential in this report, helping to reduce the costs in our models of global decarbonization.

Low-carbon refining: insane in the membrane?

Using membranes to fractionate crude oil in refining

Almost 1% of global CO2 comes from distillation to separate crude oil fractions at refineries. An alternative is to separate these fractions using precisely engineered polymer membranes, eliminating 50-80% of the costs and 97% of the CO2. We reviewed 1,000 patents, including a major breakthrough in 2020, which takes the technology to TRL5. Refinery membranes also comprise the bottom of the hydrogen cost curve. This 14-page note presents the opportunity and leading companies.


The CO2 intensity of refining and the need for economic decarbonization of the sector are quantified on pages 2-4. The discussion focuses upon the CO2 intensity of distillation, including the thermodynamics and costs.

The opportunity to use membranes in lieu of conventional distillation is presented on pages 5-6. We draw on economic models to present respective costs and CO2 intensities of membrane processes.

Hence we screened 1,000 patents to identify leading companies exploring refinery membranes. The findings are presented on pages 7-8. There are three key reasons why the technology has been slow to gain traction.

The most active patent filer in refinery membranes is profiled on page 9, a publicly listed conglomerate with headquarters in the US.

ExxonMobil has made a breakthrough in 2020, deriving permeate streams from a synthetic polymer membrane that resemble the output from a distillation column. We have reviewed the technical disclosures on pages 10-13, highlighting the commercial opportunity and remaining challenges.

Membranes can also unlock the lowest cost hydrogen in the world, recovering hydrogen that is currently wasted or purged in the effluent streams from refinery units. An industry leading example of this technology is explored on page 14.

Turning the tide: is another offshore cycle brewing?

New Offshore Cycle

Oil markets look primed for a new up-cycle by 2022, which could culminate in Brent surpassing $80/bbl. This is sufficient to unlock 20% IRRs on the next generation of offshore projects, and thus excite another cycle of offshore exploration and development. Beneficiaries include technology leaders among offshore producers, subsea services, plus more operationally levered offshore oil services. The idea is laid out in our 17-page note.


Our oil market outlook is detailed on pages 2-5, seeing 2Mbpd of under-supply by 2022 and a potential inventory draw of 2.5bn bbls.

>$80/bbl oil prices are needed to instigate a new offshore cycle, as modelled and explained on pages 6-9.

Can’t the next oil cycle be quenched purely by ramping up short-cycle shale, instead of another offshore cycle? We answer this pushback on pages 10-11.

Is another offshore cycle compatible with the energy transition and global decarbonization? We answer this pushback on pages 12-13, with detailed data on CO2 emissions per barrel offshore versus elsewhere.

Who benefits? We present the technology leaders among producers, service companies and emerging technologies on pages 14-17, drawing on our prior patent screens and technical research.

On the road: long-run oil demand after COVID-19?

Long-run oil demand after COVID-19

Another devastating impact of COVID-19 may still lie ahead: a 1-2Mbpd upwards jolt in global oil demand. This could trigger disastrous under-supply in the oil markets, stifle the economic recovery and distract from energy transition. This 17-page note upgrades our 2022-30 oil demand forecasts by 1-2Mbpd above our pre-COVID forecasts. The increase is from road fuels, reflecting lower mass transit, lower load factors and resultant traffic congestion.


Upgrades to our granular 2020-2050 oil demand models, including headline numbers, are outlined on pages 2-3.

Travel demand that will never come back is described on pages 4-5, including remote work, a shift to online retail and lower business travel. Our forecasts for higher oil demand are not based on a Panglossian recovery of travel habits to pre-COVID levels.

The shift from mass transit to passenger cars is detailed on pages 6-9, covering ground-transportation (buses and train), mid-range air travel, and reverse urbanization enabled by remote working.

Load factors are lightly reduced, requiring more cars to service each passenger-mile of travel, as outlined on page 10.

Higher road traffic dents fuel economy, which we have quantified using real-world data from the City of New York, also drawing on data from prior oil downturns, on pages 11-14.

Implications for oil markets, companies and the energy transition are discussed on pages 15-17.

Key points on long-run oil demand after COVID-19 are spelled out in the article sent out to our distribution list.

What oil price is best for energy transition?

best oil price for energy transition

It is possible to decarbonize all of global energy by 2050. But $30/bbl oil prices would stall this energy transition, killing the relative economics of electric vehicles, renewables, industrial efficiency, flaring reductions, CO2 sequestration and new energy R&D. This 15-page note looks line by line through our models of oil industry decarbonization. We find stable, $60/bbl oil is the best oil price for energy transition.


Our roadmap for the energy transition is outlined on pages 2-4, obviating 45Mbpd of long-term oil demand by 2050, looking across each component of the oil market.

Vehicle fuel economy stalls when oil prices are below $30/bbl, amplifying purchases of inefficient trucks and making EV purchases deeply uneconomical (pages 5-6).

Industrial efficiency stalls when oil prices are below $30/bbl, as oil outcompetes renewables and more efficient heating technologies (page 7).

Cleaning up oil and gas is harder at low oil prices, cutting funding for flaring reduction, methane mitigation, digitization initiatives and power from shore (pages 8-9).

New energy technologies are developed more slowly when fossil fuel prices are depressed, based on R&D budgets, patent filings and venturing data (pages 10-11).

CO2 sequestration is one of the largest challenges in our energy transition models. CO2-EOR is promising, but the economics do not work below $40/bbl oil prices (pages 12-14).

Our conclusion is that policymakers should exclude high-carbon barrels from the oil market to avoid persistent, depressed oil prices, and stabilize oil at the ‘best oil price for energy transition’ (as outlined on page 15).

Copyright: Thunder Said Energy, 2019-2024.