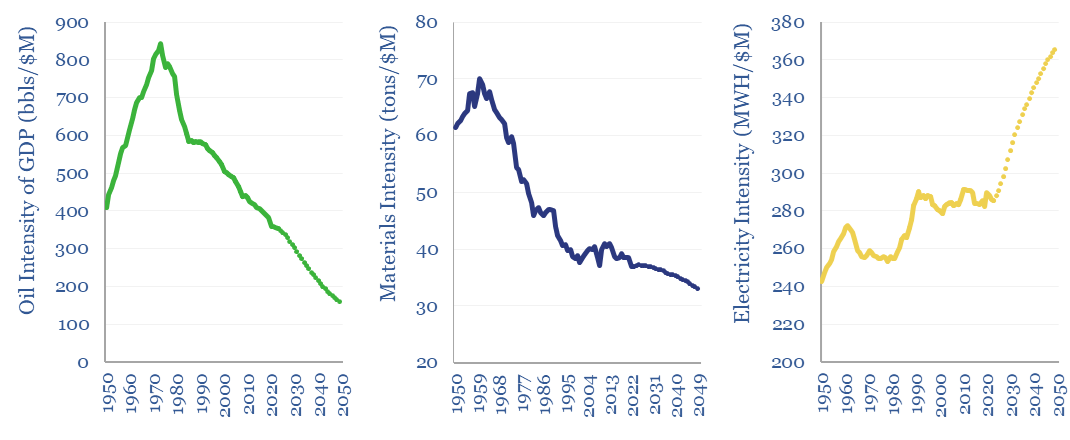
The commodity intensity of global GDP has fallen at -1.2% over the past half-century, as incremental GDP is more services-oriented. So is this effect adequately reflected in our commodity outlooks? This 4-page report plots past, present and forecasted GDP intensity factors, for 30 commodities, from 1973->2050. The -1.5% pa decline in the oil intensity of global GDP is anomalous and could even slow from here. While surprisingly many other commodities show demand increasing in line with, or above GDP growth.
Each $M of global GDP is associated with 80 tons of coal use, 350 bbls of oil, 1,360 mcf of gas, 285 MWH of electricity, 19 tons of steel, 19 tons of wood, 5 tons of plastics, 1.8 tons of ammonia, 1 ton of hydrogen, 0.7 tons of aluminium, 0.3 tons of copper. These inputs are crucial to the global economy, which in turn drives demand for these inputs.
However, a well-known economic effect is that the commodity intensity of GDP declines as GDP rises, or in other words, incremental units of global GDP tend to be more service-oriented and less energy/materials/manufacturing-oriented. This effect is quantified for different commodities on page 2, showing the commodity intensity of GDP from 1950 to 2023, plus our forecasts through 2050.
Oil intensity of global GDP is particularly interesting, showing one of the larger historical declines among different commodity categories in our database. And for good reason. Oil is expensive relative to other energy commodities. And three categories of global oil demand, have been particularly easy to substitute. Hence fifteen different oil product sensitivities to GDP are plotted on page 3.
Each incremental $1k increase in GDP per capita has tended to unlock 0.75 MWH pp pa of primary global energy demand based on regressions back to 1965. This can be explained by incremental global GDP shifting towards services over time. This is charted on page 4.
Overall, the report sense-checks our long-term commodity forecasts, draws out key conclusion into the commodity intensity of GDP, and finds that the historical trend differs sharply by commodity. For surprisingly many commodities, the relationship with GDP is a 1:1 beta, or evan a >1:1 beta, as highlighted on the conclusions page.
