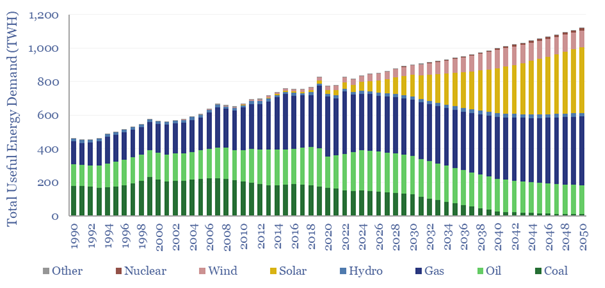
Australia’s useful energy consumption rises from 820TWH pa in 2023, by 1.2% pa, to 1,100 TWH pa in 2050. As a world-leader in renewables, it makes for an interesting case study. This Australia energy supply-demand model is disaggregated across 215 line items, broken down by source, by use, from 1990 to 2023, and with our forecasts to 2050.
Australia is a nation of 27M people, generating $67k of GDP per capita, due to a stable and resource-rich economy. Useful energy consumption per capita is c30MWH pp pa, which is one of the highest levels in the world.
This data-file aggregates our assumptions in other TSE data-files, summarizing Australia’s economic outlook, energy demand, electricity demand, wind and solar deployments, gas demand, coal demand, oil demand, EV deployment and LNG exports.
Australia makes a fascinating case study, because renewables (wind and solar) have already increased to 28% of its grid (one of the highest renewables penetrations of any country in the world, case study here), but by 2050, we also think renewables can reach 70% of Australia’s total grid, the most of any country/region in our models.
This may seem surprising as previously we have argued wind and solar would naturally cap out at 50-55% of power grids without backstops; but we have also outlined how solar alone can reach c45% through a combination of load-shifting and new demand creation.
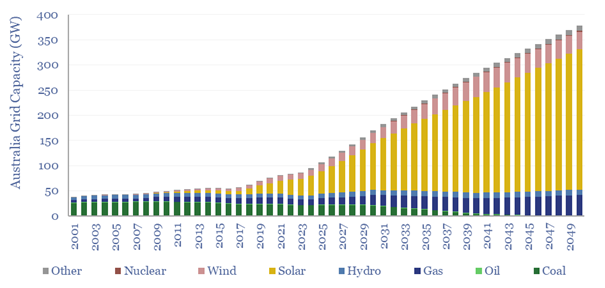
Addition, not transition. Electricity demand is seen rising by 2.5x to 700 TWH by 2050, or from 35% to 60% of useful energy consumption. The chart below shows how grid capacity is rising from 90GW to 380GW. The requirement for thermal capacity does not fall at all, but actually grows from 33GW to 42GW by 2050.
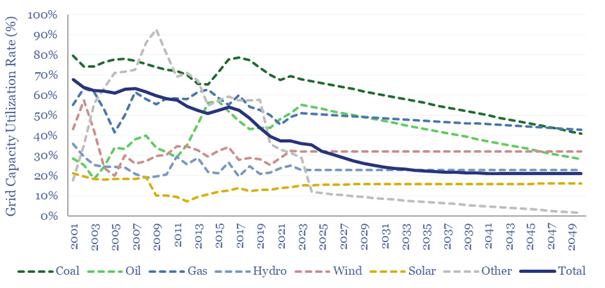
Falling utilization of the grid is thus a feature of this system, which is mildly inflationary. Utilization across Australia’s grid has already fallen from 68% in 2000, when the grid was 80% sourced from 80%-utilized coal, to 35% in 2024 and falls to 20% by 2050.
New flexible demand must be added to absorb volatile renewables generation, across EV charging in transport, electrification of trucks along eHighways, residential/commercial heat pumps and other smart energy, electrification of LNG plants, electrification of mining, desalination of water. There is a lot of load that can flex.
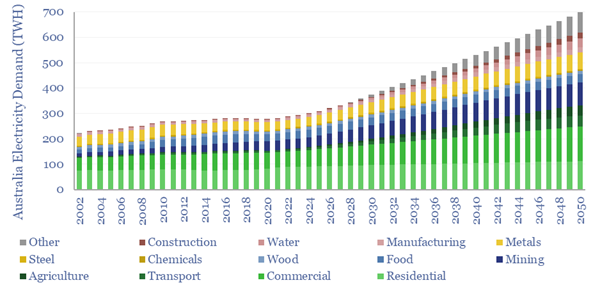
The structure of Australia’s energy demand also supports electrification and renewables integration. Road transport is 30% of total final energy consumption, while metals and mining are 20%, and these are among the sectors that are most readily electrified via renewables. Residential and commercial are 20% of final consumption.
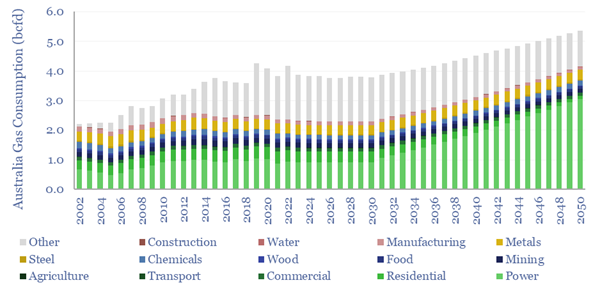
Australia’s gas consumption still rises from 4bcfd to 5bcfd by 2050 in our outlook, as ultimately solar+gas offers the lowest cost option for round-the-clock, ratable electricity, across parts of the grid that cannot load shift (note here).
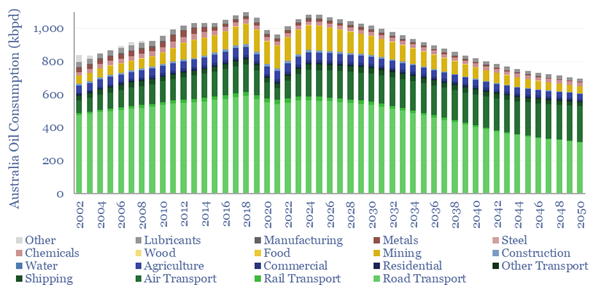
Australia’s oil consumption has peaked at 1.08Mbpd in 2024 and falls back to 700kbpd by 2050, in our outlook, mainly as electrification competes with oil in light-duty transportation; however high costs make it harder to displace oil in other categories.
Overall, Australia’s CO2 emissions from the energy sector have already peaked at 440MTpa in 2008. Emissions have already fallen back to 380MTpa by 2024 and are seen declining to 200MTpa (gross basis) by 2050. Reaching net zero is thus still achievable in Australia, through CO2 removals and CCS, even if it is no longer looking feasible, or indeed on the political agenda in other regions of the world.
To explore or stress-test the numbers, please download our Australian energy supply-demand model, via the link below. All of our other input models are available via a TSE subscription.
