Residential energy prices tend to run 4x higher than underlying wholesale energy prices. This is a very wide margin, as by contrast, typical commoditized products in supermarkets are usually only marked up by about 2x, compared to their wholesale prices. Today’s data-file compares retail prices vs wholesale prices across a dozen different categories.
A remarkable feature of residential electricity prices, in both the US and Europe, is that the costs of generating electricity only comprise about 25% of the total price paid by consumers. Or in other words, the electricity price paid by residential consumers is 4x underlying wholesale electricity prices. The ratio is volatile, year by year, but 4x is a good average across the times series charted below, and downloadable here.
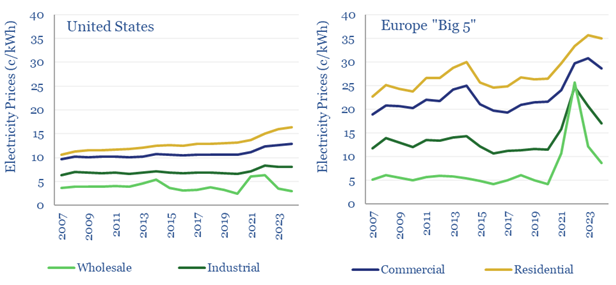
For example, over the past five years, wholesale electricity prices across the US have averaged about 4.3 c/kWh (more data here and here), while residential electricity prices have averaged 15c/kWh, according to the EIA. Three-quarters of the costs are in transmission, distribution and providing utility services to end-customers.
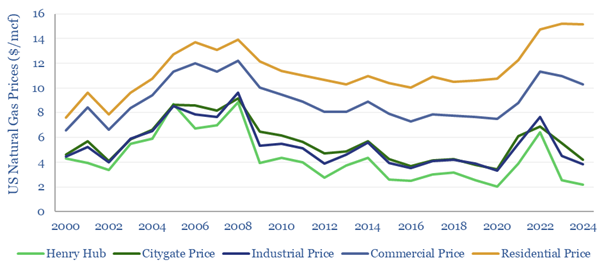
A similar 4x ratio between retail prices vs wholesale prices is found in US gas markets, charted below, and with data available here. Over the past five years (2020-24), Henry Hub gas prices averaged $3.3/mcf, while the nationwide residential US gas price has been 13.1/mcf, for a 4x mark-up. Although in 2024, the mark-up (temporarily) widened to 7x, as Henry Hub gas prices fell back to just $2.2/mcf, while residential gas prices remain near all time highs of $15.1/mcf.
These mark-ups for distributing energy to residential consumers are much higher than for distributing other products to consumers, which we wanted to quantify in this data-file.
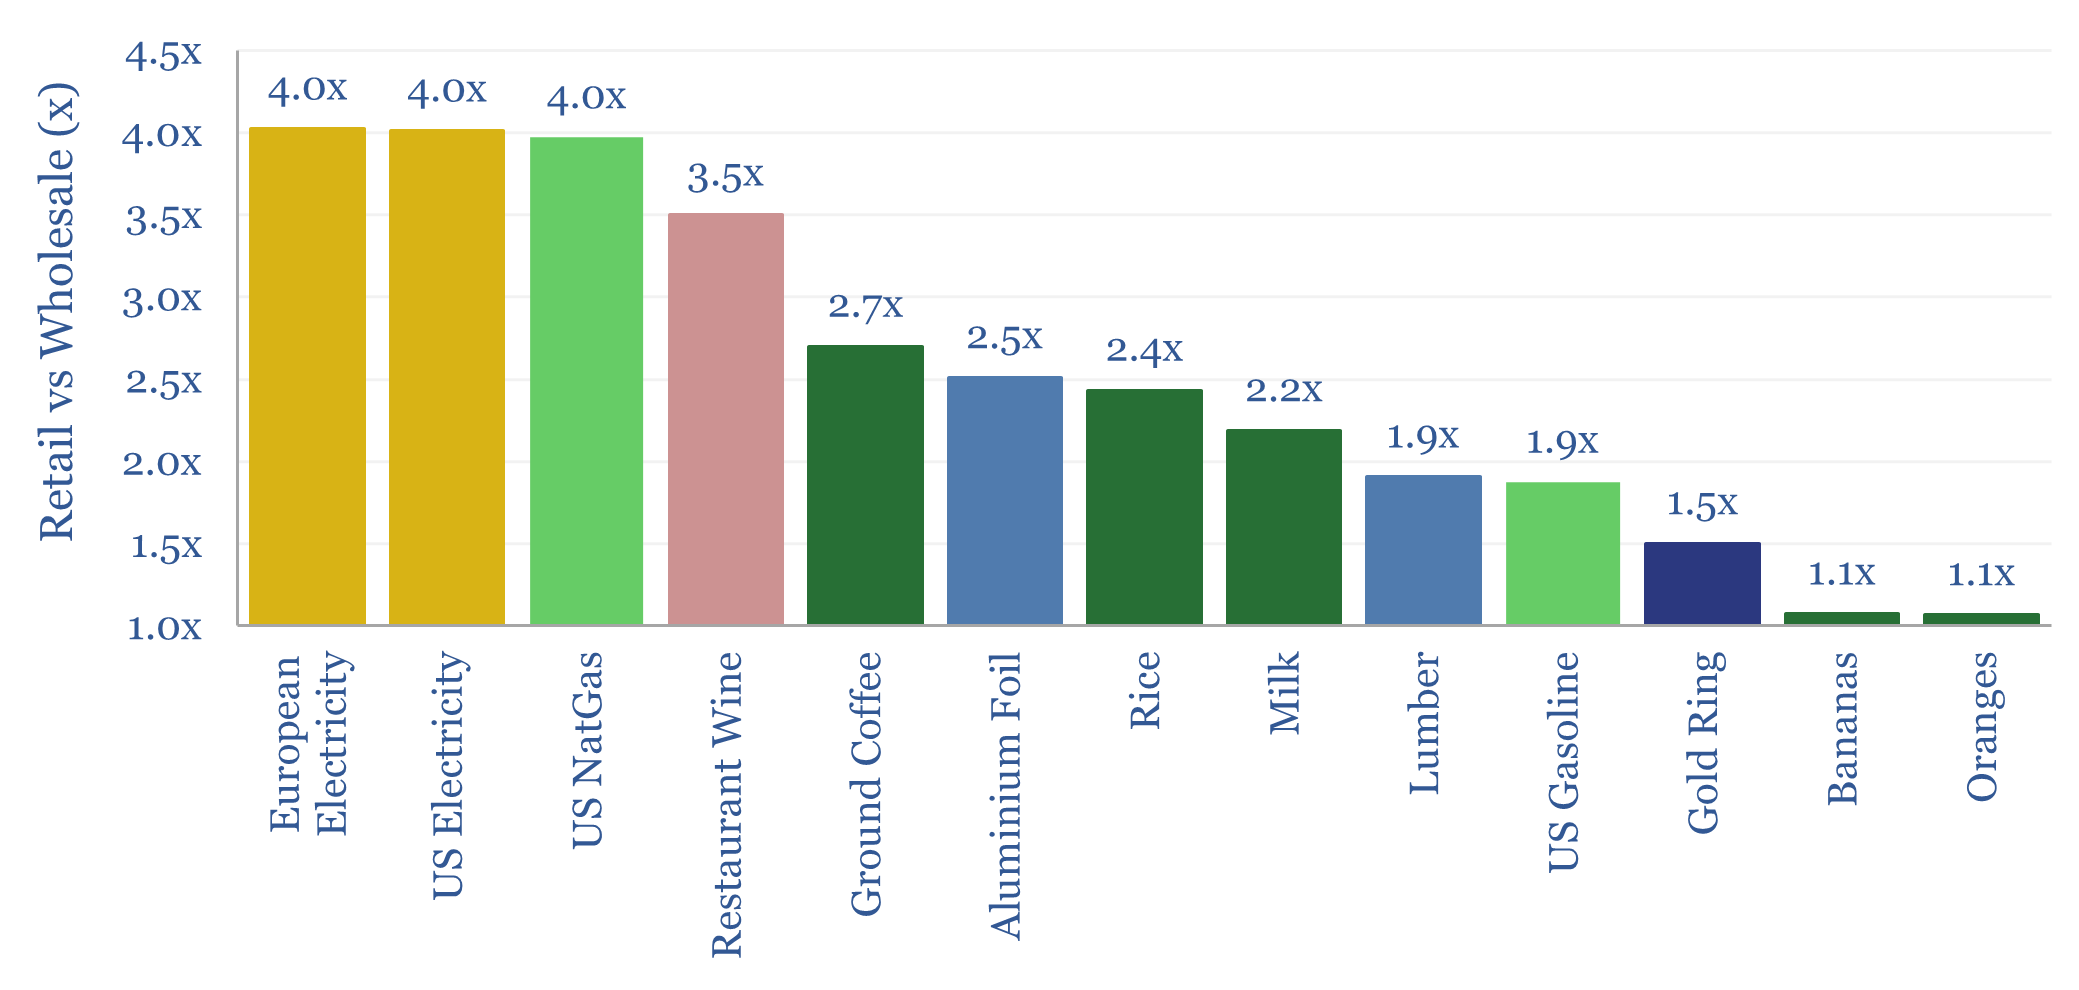
For example, the World Bank’s Pink Sheets give wholesale pricing data for food products such as oranges, bananas, rice and coffee, while if we go to Tesco’s website and simply look up the prices for these products ‘in store’, they tend to be around 1.1x – 2.7x higher than wholesale prices. The higher mark-ups are found in products like coffee and rice, which require some processing and packaging, unlike bananas and oranges which come in their own natural packaging. In a sense, electricity and gas are more like the latter category than the former. No one has to “put your electricity in a plastic bag”.
Another remarkable example is milk, which leaves the average UK farm at about 41 pence per liter, gets pasteurized, processed, packaged, transported, put on shelves, refrigerated and then retailed, for an ultimate retail price of about 95 pence per liter. So this entire value chain only sees a 2.2x mark-up from wholesale to retail.
Yet another remarkable example is oil products. The WTI oil price at Cushing in 2024 was $77/bbl. This oil can be transported, refined, upgraded, trucked, retailed (including adding 17% tax on average in the US), with an end price of $3.42/gallon on average in 2024, which is equivalent to $144/bbl and only around 2x the raw oil price.
These counter-examples do somewhat make downstream gas and power utilities ‘look bad’. Other examples are tabulated in the data-file and are in the chart above. Note it would not be true to say that gas and power have the most egregious mark-ups between retail prices vs wholesale prices of any product. Buy a $10 shirt from H&M and you are paying about 40x more than the underlying value of the cotton or polyester.
Nevertheless, this is all a reason for optimism over the deployment of AI. Some commentators fear that the energy consumption of AI will raise wholesale power prices, in a way that is inflationary for end-consumers. But we disagree.
Network costs are 3x wholesale prices. So, using AI to smooth out grids, streamline network maintenance, and automate customer service functions (case study here) can generate savings that materially outweigh possible increases in wholesale energy prices.